No one can be complacent about geopolitical risks these days. The shocks and surprises of the past few years show how easily assumptions about liberal markets, international relations, conflict, and democracy can be shaken. Geopolitical volatility has become a key driver of uncertainty, and will remain one over the next few years.
This study looks at three risks with geopolitical consequences and interconnections: protectionism, energy crisis, and water and food scarcities. While the threat of growing protectionism is a daily feature in the news, an energy crisis resulting from the worsening Middle East situation or the spread of water scarcity could also disrupt the world. Should any of these situations become full blown, the impacts would be nothing less than earth shattering for how the world governs or does business.
The authors also sketched out possible risk management strategies that governments and businesses could use to mitigate the negative consequences of risks. This should help boards and risk managers better understand the potential impact of various geopolitical risks on their financial and physical assets, operations including supply chains, and people.
Table of contents
Protectionism’s disruptive path in the globalized world
- Our scenarios
- Major geographical implications
- Implications of worsening China-US trade dynamic
- Risk management implications
Energy crisis resulting from conflict in the Middle East
Water and food scarcity: already a major risk
Introduction
No one can be complacent about geopolitical risks these days. The shocks and surprises of the past few years show how easily assumptions about liberal markets, international relations, conflict, and democracy can be shaken. Geopolitical volatility has become a key driver of uncertainty, and will remain one over the next few years.
The three risks with geopolitical consequences and interconnections examined in this study—protectionism, energy crisis, and water and food scarcities—are growing. While the threat of growing protectionism is a daily feature in the news, an energy crisis resulting from the worsening Middle East situation or the spread of water scarcity could also disrupt the world. Should any of these situations become full blown, the impacts would be nothing less than earth shattering for how the world governs or does business.
Geopolitical risks are interrelated, so they need to be looked at holistically in the context of other risks. Understanding the connections between different kinds of risks is a vital step in managing them and avoiding surprises. There are numerous interconnections explored here: water and food scarcities are perhaps the most interrelated, but escalating China-US tensions would greatly increase the risk of protectionism, and energy and water shortages would be aggravated by increasing trade barriers. There are also interconnections between water and energy in that water systems often require energy sources to be able to operate.
Scenarios are a critical device for mapping the ways risks can balloon into full-scale crises. Scenarios can show how single risks can trigger scores of others. Nobody can ignore “large impact but small likelihood” scenarios. All too frequently, those “black swans” have indelibly recast the geopolitical landscape. It is important for companies, as well as governments, to understand the triggers, trends, and scenarios for which to look out, and to prepare for the possible consequences of any of those risks.
In this study, a singular base-case scenario is used to get a sense of the possible deviation from what most assume
will be the future trend. The timescale is to 2035, allowing a view of these uncertainties’ long-term impact.
For each scenario, this study measures possible outcomes in terms of consequences for global gross domestic product (GDP), extreme poverty, middle-class growth, and country stability—at a global level and, in specific cases, at regional and country levels. Comparing the geopolitical scenarios and their impacts provides a better sense of the scale of the different risks.
This study concentrates on global risks. More regional sets of risks—such as the evolution of Europe—could also have global consequences, but have been excluded in order to better focus on large-scale global risks.
The method used to quantitatively evaluate the geopolitical risks is drawn from the International Futures (IFs) model, housed at the Frederick S. Pardee Center for International Futures at the University of Denver. The IFs tool is an integrated assessment model, meaning that it quantitatively connects variables across countries, time, and issue areas, to create a macro-level framework for thinking about how geopolitical risks are likely to unfold.
In concluding analysis of each scenario, this study’s authors sketched out possible risk management strategies that governments and businesses could use to mitigate the negative consequences of risks. This should help boards and risk managers better understand the potential impact of various geopolitical risks on their financial and physical assets, operations including supply chains, and people.
This is the third in a series of reports in which there has been a collaboration between Zurich Insurance Group, the Washington-based Atlantic Council, and the University of Denver’s Pardee Center examining the proposition of whether global risks are growing faster than global economic growth. The first report, published in September 2015, focused on cyber risks. A second, on changing demographic risks, was published in September 2016.
Methodology
The International Futures (IFs) model is a free and open-source quantitative tool for thinking about long-term futures. The platform helps users to understand dynamics within and across global systems, and to think systematically about potential trends, geopolitical risks, and the implications of environmental uncertainties. While no software can reliably predict the future, IFs forecasts—which are calculated using historical data and a mix of quantitative modeling approaches—offer a broad and transparent way to think about some of the tradeoffs in geopolitics.
There are three main avenues for analysis in IFs: historical-data analysis (cross-sectional and longitudinal) of more than 3,500 series, base-case analysis (how dynamic global systems seem to be developing), and alternative-scenario development (exploring “if-then” statements about the future). To do this, IFs integrates relationships across 186 countries and twelve core systems, including: agriculture, demographics, economics, education, energy, environment, finance, governance, health, infrastructure, international politics, and technology. The sub-models for each system are dynamically connected, so IFs can simulate how changes in one system may lead to changes across all others. As a result, IFs endogenizes more variables and relationships, from a wider range of key development systems, than any other open-source model in the world.
IFs is developed by the Frederick S. Pardee Center for International Futures, based at the Josef Korbel School of International Studies at the University of Denver in Colorado, USA. It was originally created by Professor Barry B. Hughes.
Learn more about IFs, or download the tool for free, at pardee.du.edu/GeopoliticalRisk.
I. Protectionism’s disruptive path in the globalized world
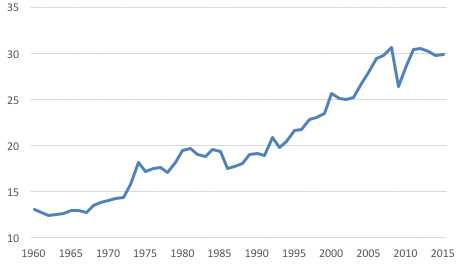
Since the 2008 financial crisis, growth in trade openness has stagnated and protectionist measures have increased. Recent years have seen a political backlash against free trade and globalization in wealthy countries, along with a slowdown in export trade. While high-income states have been among the biggest beneficiaries from globalization, there is growing evidence of unequal benefits within countries. Many voters in the United States and Europe blame free-trade agreements for the loss of well-paying, middle-class jobs.1Federica Cocco, “Most US Manufacturing Jobs Lost to Technology, Not Trade,” Financial Times, December 2, 2016, https://www.ft.com/content/dec677c0-b7e6-11e6-ba85-95d1533d9a62 Brexit and President Donald Trump’s victory partly stem from this growing antiglobalism mood. Since his election, Trump has fulfilled his electoral pledge to remove the United States from the Trans-Pacific Partnership (TPP) agreement, and has called for a renegotiated North American Free Trade Agreement (NAFTA) to reduce the US trade deficit. Upcoming 2017 political contests in Europe could see newly elected leaders implement protectionist measures, including cutbacks in the free movement of people. In the past, protectionism has led to more instability, including conflicts between countries.
Other factors, such as Chinese curbs on foreign investment, are raising business concerns about China’s commitment to openness. Growing China-US military tensions over the South China Sea could spill over to accelerate the trend toward more trade and investment restrictions.
Global exports as a percent of GDF
Our scenarios
In mapping the implications around protectionism, this study’s authors examined three possible variants reflecting the wide array of possible futures, including one in which protectionism is reversed:
1. Globalism Resurgence is set around a rebound in trade in goods and services and foreign direct investment (FDI), which could include modified versions of TPP and the Transatlantic Trade and Investment Partnership (TTIP).
2. Protectionist Victory leads to a significant reduction in trade in goods and services, and in FDI as a share of GDP.
3. The Base Case reflects a continuation of the recent flattening of global trade flows and FDI as a share of GDP.
In gauging the geopolitical upsides and downsides, the authors paid close attention to the effects of each of these scenario variants on the following:
Poverty and Middle-Class Levels: Not all economic growth is pro-poor. But, on average, an increase in mean income will lead to a reduction of the proportion of people living in poverty. Therefore, in the long run and on average, increased trade should help to alleviate poverty and grow the middle class. While additional trade can remove people from poverty, it also exacerbates inequalities (one driver of the current push for protectionism).
State Fragility and Conflict: Trade and economic interdependence are generally believed to have a pacifying influence on domestic instability. Heightened trade between two countries, as well as trade openness, is linked to rarer incidences of militarized conflict. A recent academic study showed that countries that anticipate a beneficial economic relationship with one another will want to maintain friendly relations. But, if trade expectations are bleak, countries will have fewer constraints against conflict.2Dale C. Copeland, Economic Interdependence and War (Princeton, NJ: Princeton University Press, 2014).
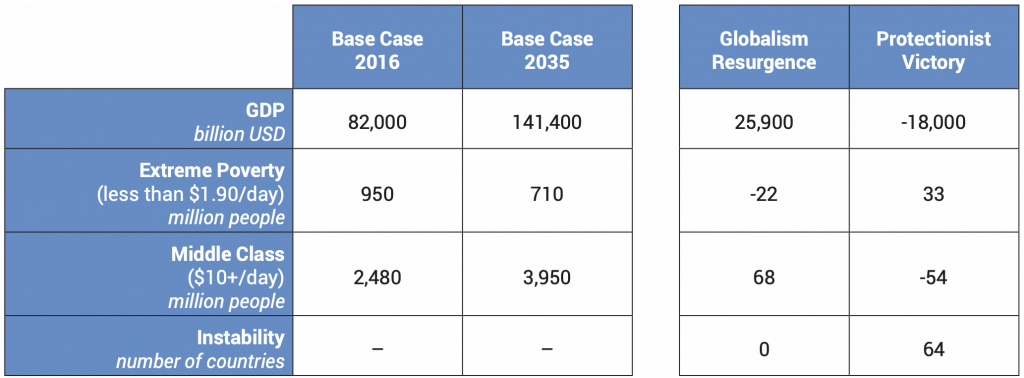
Summary for the scenario variants
Major geopolitical implications
Greater protectionism leading to slower global growth would hurt all countries, but developing ones are most vulnerable.
- Between Globalism Resurgence and Protectionist Victory, there is a cumulative difference in global economic output of $44 trillion by 2035. In Protectionist Victory, GDP is 8 percent lower in low-income economies by 2035, compared with Globalism Resurgence. High-income countries would see a 5 percent drop.
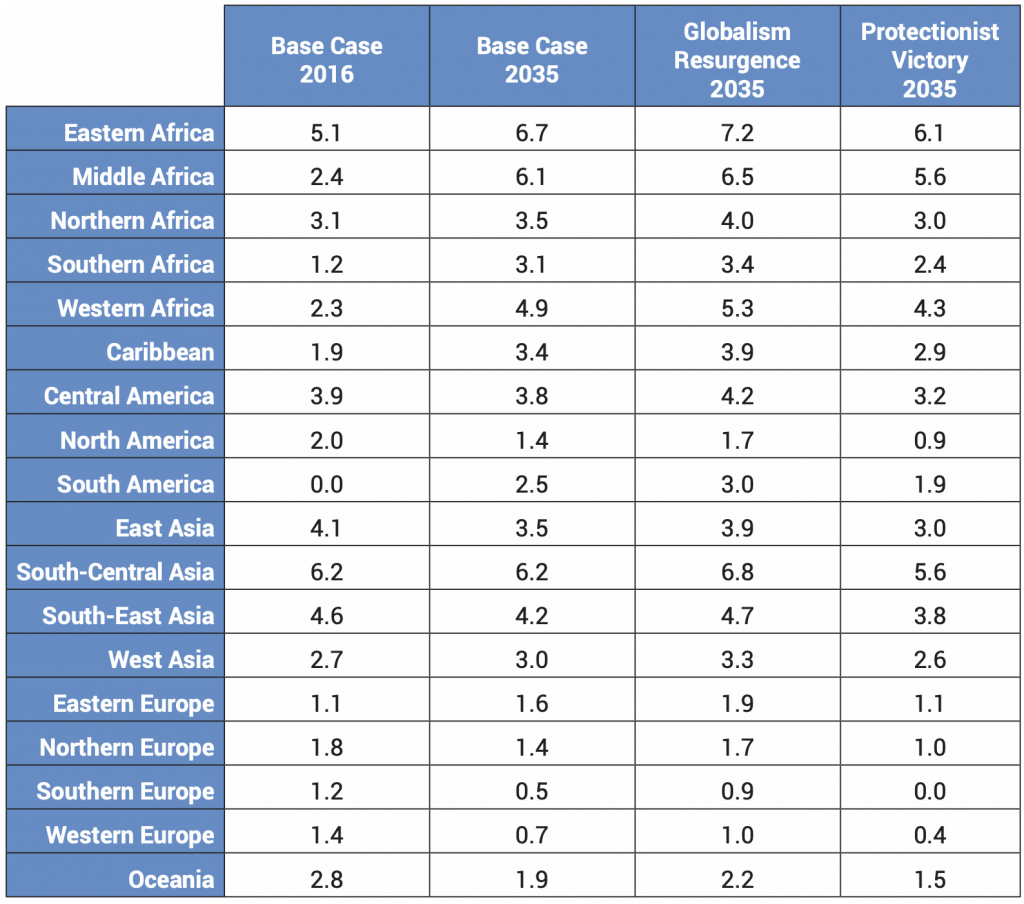
- The foregone gains seen in Protectionist Victory, as compared to Globalism Resurgence, are felt more strongly in countries that have not yet been able to take full advantage of the global economy. Africa and Central America, for example, appear the most sensitive to long-term protectionist policies (see chart on p. 10).
- With some European countries, such as those of Southern Europe, already forecast to see lower levels of growth over the coming decades in the Base Case, an increase in global protectionism on the scale simulated in Protectionist Victory could translate into an economic slowdown.
The difference in the number of people living on $10 or more per day between Globalism Resurgence and Protectionist Victory would be more than one hundred and twenty million people by 2035, or roughly the size of Mexico’s or Japan’s population today.
- While the rough proportion of middle- and upper-class population in high-income economies remains largely the same across these scenarios, increased global protectionism undermines the growth of a middle class in the rest of the world.
- In Globalism Resurgence, in nations outside of the Organization for Economic Cooperation and Development (OECD), the middle class (defined as the population living on between $10 and $50 per day) grows from 1.2 billion today to 2.4 billion in 2035, whereas in Protectionist Victory, the non-OECD middle-class in 2035 grows to only 2.3 billion—one hundred million fewer. Between the two scenarios, Africa, South Asia, and Central America see the most significant difference in the share of the population living on $10 or more per day.
Relative to the Base Case, the probability of violent domestic conflict increases in sixty-three countries in Protectionist Victory. The growing violent conflict is driven by stalling human development and government capacity in Protectionist Victory. India, Egypt, the Philippines, and Thailand are among those that experience the greatest increase in risk of instability under Protectionist Victory.
Economic growth rates by region
Implications of worsening China-US trade dynamic
The China-US partnership has been at the heart of globalization in recent decades, so it is appropriate to unpack the implications of slapping high US tariffs on Chinese manufactured goods and possible Chinese retaliation. The authors recognize that the new Trump administration might not implement its campaign promise, but the analysis illustrates what might be considered an outer boundary of risk. Worsening China-US ties increase the risk of protectionism.
Today, imports from China are valued at 2.3 percent of the US GDP (with manufacturing imports from China valued at 1.3 percent of US GDP). Exports to China are valued at 0.6 percent of US GDP (with manufacturing exports to China valued at 0.4 percent of US GDP). Imports from the United States are valued at 8.8 percent of Chinese GDP (with manufacturing imports from the United States valued at 0.7 percent of Chinese GDP). Exports to the United States are valued at 18.9 percent of Chinese GDP (with manufacturing exports to the United States valued at 2.2 percent of Chinese GDP). China is nearly twice as dependent on US trade
as the United States is on Chinese trade.
The countries’ ability to adjust to the shock of much higher US tariffs is determined partially by their relative trade dependence, and how easily capital and labor can be reallocated given new consumption and production patterns.
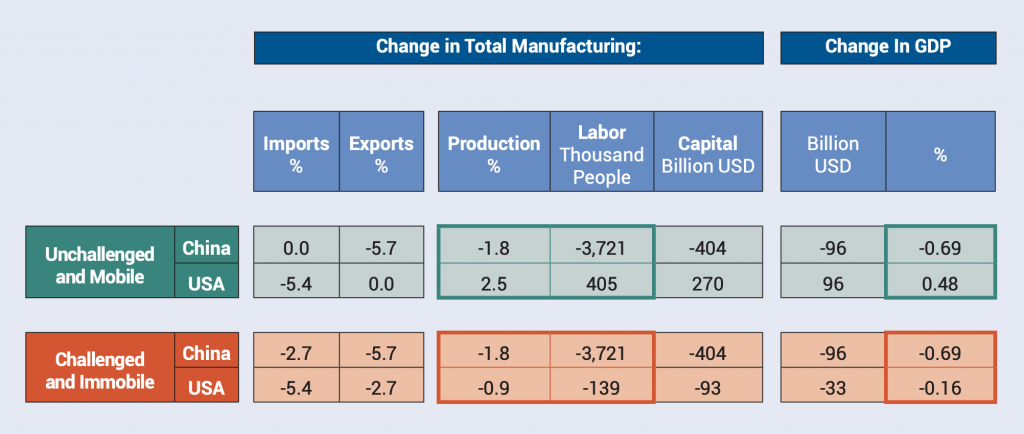
In the short run, a 45 percent punitive tariff imposed by the United States on Chinese manufactured goods would drive a 2.5 percent increase in US manufacturing production, four hundred thousand additional jobs, and a 0.5 percent increase in GDP (see chart below and the figures in the solid green-outlined box). This, however, assumes that China does not retaliate with a similar (or more significant) tariff on US exports, that the United States does not offset surplus demand with imports from other trade partners, and that the United States is able to quickly and efficiently mobilize the necessary labor and capital to produce all surplus demand domestically. If China were to reciprocate with similar tariffs and substitute US imports from other partners—or if the United States is unable to quickly mobilize its factors of production—the United States would experience a 0.9 percent reduction in manufacturing production, a loss of one hundred and thirty nine thousand jobs, and almost a 0.2 percent reduction in GDP (see chart below and solid red-outlined boxes). China would lose a substantial 3.7 million jobs in either scenario.
Trade conflict between the United States and China
In the long run, forecasts from IFs modeling indicate that trade between the two countries could decline by a cumulative $5.7 trillion by 2035 relative to the Base Case. Cumulative GDP would be $5.5 trillion lower in the United States, and $4.2 trillion lower in China relative to the Base Case by 2035. Household consumption in the United States would decline by an annual $550 billion relative to the Base Case by 2035. While household consumption in China would initially increase, due to cheaper domestic prices, by 2035 it is roughly $120 billion lower than in the Base Case.
If the mutual tariffs stayed in place, because of growing hostilities or a mutual trade conflict, separate spheres of Chinese and US economic activity would likely be created, rewiring current trade networks and significantly disrupting supply chains.3This scenario, distinct from the manufacturing tariff scenario above, also assumes an increase in US and China military spending, with NATO members reaching the current military spending target of 2 percent of GDP. China has one of the highest participation rates in global value chains. With the rise in China’s economic importance, many countries that had been closely aligned with Western countries are increasingly reliant on Chinese trade.
Over fifteen to twenty years, separate China-US spheres of economic activity could result in a $95 trillion cumulative reduction in global exports. Foreign-investment growth would slow globally, but the United States and China would probably increase foreign aid to allies and partners to shore up ties.
The reduced trade would put the world on a lower economic growth trajectory, according to IFs. Global GDP would be reduced by a cumulative $35 trillion, leading to twenty million additional people living in extreme poverty, forty-five million additional people living on less than $3.10 per day, and eighty-eight million fewer people living on $10 or more per day globally.
GDF reductions from separate US and Chinese spheres
Risk management implications
Fundamental challenges to the global economic and political system created by major western powers after World War II are creating highly uncertain environments for companies. Crisis management approaches can help focus on the identification and mitigation of risks—in this case, the impacts from protectionism.
Many firms benefit from global value chains which can be essential to their very existence. Restructuring supply chains is not a simple task. There may not be a lot of time to restructure supply chains, particularly as governments are likely to react swiftly once any one government enacts trade restrictions. Companies will need to develop business continuity plans that anticipate having to arrange substitute suppliers and designate alternative manufacturing or retail sites. New technological innovations such as 3-D printing can in some cases allow for more manufacturing in place and, as such, could provide a way for companies with manufacturing needs to lessen dependence on global supply chains.
It is very important for companies with critical supply chains that they understand their exposures to geopolitical actions. Technology can be useful in developing a holistic picture of the critical supply chain. Companies can adopt a number of mitigation strategies including the purchase of supply chain insurance to protect against supply chain disruptions. In addition, many political risk insurance (PRI) policies cover against import and export embargoes or license cancellations which might be imposed in a trade war or for other reasons.
As supply chains are disrupted, another knock-on effect is the financial impact on both buyers and suppliers along the supply chain. If companies are unable to deliver to their customers due to supply chain disruptions, their own financial health can be jeopardized. Large, unexpected increases in tariffs could increase costs to such a degree that buyers default on contracts. Again, insurance, such as trade credit insurance, can play an important role in mitigating the risk for companies with these types of exposures.
Increased protectionism is likely to raise costs for manufacturers in other ways: higher inventory handling costs, alternative sourcing options from higher cost suppliers, transportation delays due to border controls and customs charges. In export-dependent countries, reduced trade could translate into lower economic growth, higher unemployment and political unrest, leading to higher risks for firms with exposure in these countries. PRI is one solution to cover some of the most catastrophic of these risks, including but not limited to political violence causing damage to assets.
Business associations are already vigorously engaging governments and policymakers on the business consequences of key trade policy changes. It is still unclear how far these efforts can go to influence governments that are under pressure from a groundswell of protectionist and nationalist sentiment. However, the stakes for firms and for entire economies are too high to ignore. An awareness of key industrial clusters within a supply chain is also important as there can be a tendency for human skills to be clustered around a certain location, which may be impacted by geopolitical tensions.
Indeed, setbacks to global trade will likely cause a number of unintended consequences, and government economists will be under pressure to conduct very sophisticated analyses to determine the full impact on their respective economies. Assessing the impact of protectionism on consumers, tax revenue, economic growth, and companies is a massive exercise in itself, but then trying to predict how other governments will respond is an even more daunting exercise. Scenario planning will be a key tool to assess these risks.
Governments will also need to develop continuity plans, examining the impacts on national security from cutoffs supply chain disruptions or increased costs of imports. Governments and companies should both consider using tools such as bold scenario planning to map the potential second and third order effects resulting from greater protectionism. Governments may not be aware of their dependence on global value chains for their ability to carry out vital government functions. An inventory of ways that key government functions rely on imports could prevent later surprises.
As a way to mitigate disruptions, governments could explore strengthening trade relationships with nonrestrictive countries and sometimes this can lead to productivity gains and economies of scale not previously thought. For companies active in global markets, assessing the likely course of events will become ever more difficult, but it is some consolation that there are risk management techniques to help mitigate the potential financial impacts.
II. Energy crisis resulting from conflict in the Middle East
The risk of large-scale conflict in the Middle East—which remains the region with most of the world’s oil—has been steadily increasing in recent years. At the core of the tensions is growing enmity between Saudi Arabia and its Gulf partners against Iran. For Saudi Arabia and the Gulf powers, the US invasion in Iraq upset the Sunni-Shia balance with the establishment of a Shia-led government in Baghdad. Iran increased its regional influence by backing the Bashar al-Assad regime, which is winning the Syrian civil war despite large-scale Saudi and Gulf support for the opposition forces. At the same time, Saudi Arabia and the United Arab Emirates are engaged in a costly fight against the Iranian-backed Houthis in Yemen. Saudi Arabia has become one of the world’s biggest importers of defense equipment, because of its rising military commitments and concerns about growing Iranian power.
In 2012, the computer network of Saudi Aramco, Saudi Arabia’s national petroleum and natural-gas company, was struck by a self-replicating virus—later dubbed Shamoon—that infected as many as thirty thousand of its Windows-based machines. Aramco took almost two weeks to recover from the damage. Most cyber specialists believe Iran was behind the attack, though this has never been proven. Western observers were alarmed that “an attack of this scale was carried out against a company so critical to global energy markets.”4Christopher Bronk and Eneken Tikk-Ringas, “The Cyber Attack on Saudi Aramco,” Survival: Global Politics and Strategy vol. 55, no. 2, http://www.iiss.org/en/publications/survival/sections/2013-94b0/survival–global-politics-and-strategy-april-may-2013-b2cc/55-2-08-bronk-and-tikk-ringas-e272.
This was not the first time that Saudi oil facilities had been attacked. In 2006, there was a failed physical assault by terrorists on the petroleum-processing complex at Abquaiq, after which the government stepped up its protection of petroleum operations in Saudi Arabia. Saudi and US authorities agreed at the time that “even a partial disruption of production facilities in an area such as the country’s Eastern Province would have an immediate impact on oil supplies and prices, with knock-on effects for the global economy.”5Ibid
Saudi Arabia and the Gulf states were opposed to the international negotiations with Iran. In return for stopping its nuclear-weapons program, Iran was allowed sell its oil on the world market. In late November 2016, the Organization of the Petroleum Exporting Countries (OPEC) agreed to production cuts, but Iran was allowed “to raise output to about 3.8 million barrels a day”—a victory for Tehran, which sought “special treatment as it recovers from sanctions.”6Nayla Razzouk, Angelina Rascouet, and Golnar Motevalli, “OPEC Confounds Skeptics, Agrees to First Oil Cuts in 8 Years,” Bloomberg, November 30, 2016, https://www.bloomberg.com/news/articles/2016-11-30/opec-said-to-agree-oil-production-cuts-as-saudis-soften-on-iran. Saudi and other oil producers have worried that the increased supplies would cause a glut on world markets, and that Iran would use the increased revenues to fund its proxy terrorist group, Hezbollah.
This scenario does not predict there will be a further Saudi-Iranian crisis in which both sides will target each other’s energy production. In light of the growing tensions and historic attacks on Saudi production facilities, it examines what the broader geopolitical implications would be if an escalating conflict flattened energy production among Middle East OPEC countries. What other energy resources elsewhere would be available to defray the Middle East losses? And, given the growth of renewables in the world, what role could renewables play in replacing the lost fossil-fuel production coming out of the Middle East?
Summary for the scenario variants
Our scenarios
In mapping out the major geopolitical implications of a loss of Middle East energy supplies, this report’s authors examined three variants reflecting the wide array of possible futures, including a Base Case in which there is no escalation of conflict, and Middle East oil supplies continue to flow on the world market.
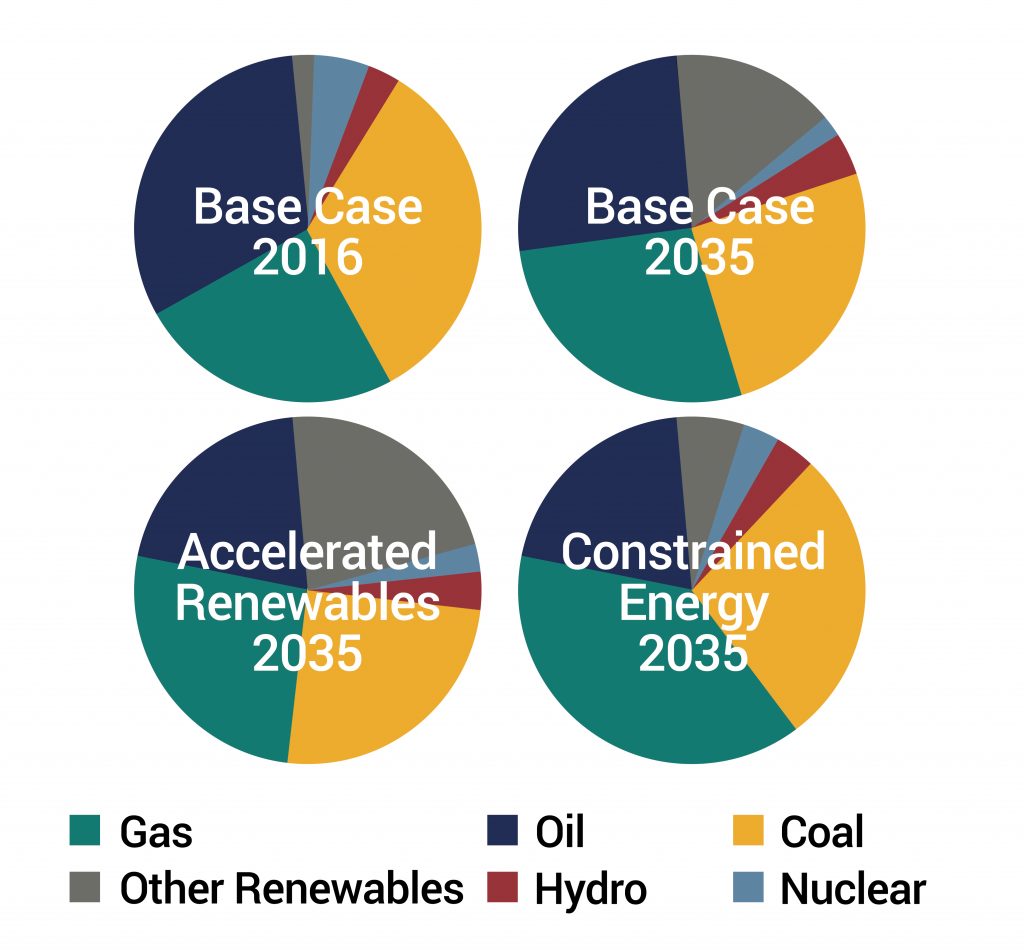
- Constrained Energy: Other sources of energy, including renewables, cannot make up for the loss of Middle East energy supplies. There is a 35 percent increase in total world energy prices.7These results reflect the total change in energy across all major categories. Individual categories that are directly impacted by this scenario (such as oil) will see a much larger spike in price. Russia, Canada, China, Brazil, the United States, and Venezuela cumulatively increase production by an additional twenty billion barrels of oil.
- Accelerated Renewables: In a world in which Middle East and OPEC oil production is significantly reduced, renewables become more competitive. Energy prices rise in the short term, and spur further investment in the development of renewables.8Renewable energy in IFs includes wind, solar, biomass, and other renewable sources, excluding hydropower.
- Base Case: Current tensions do not escalate. There is no direct conflict between Iran and Saudi Arabia, only sporadic targeting of each other’s energy production facilities and the 2015 United Nations Climate Change Conference (COP 21) commitments are largely respected.
The oil shocks of 1973, when Arab oil producers proclaimed an embargo on countries supporting Israel in the Yom Kippur War, and of 1979, when the Iranian Revolution triggered interruptions in that country’s oil exports, provide limited insight into how energy markets would react to a high-intensity conflict in the region. In those cases, international markets reacted disproportionately to actual losses, boosting long-term price increases. Producers in Norway, Mexico, and Venezuela—and Texas and Alaska in the United States—experienced large economic gains. The oil shocks, however, also helped trigger the recessions experienced by the developed world in the 1970s.
A future oil shock is not likely to play out the same way. Following the 1970s oil shocks, many countries created strategic petroleum reserves and crude-oil inventories, for the purpose of providing economic security during future oil crises. The United States and China, along with other developed countries, have the largest reserves. This suggests future oil shocks emanating from the region will be felt less severely by the developed world.
The 1970s oil shocks also contributed to the development of renewable energy sources. Renewables constitute an increasing portion of the global energy mix and, theoretically, they could be a cost-effective and environmentally attractive alternative to traditional fossil fuels. However, their potential to fulfill demand for cheap energy in response to high oil prices is uncertain.
Fossil fuels and renewable energies cater to different sections of the energy market. Oil is largely used for transportation fuel, and renewables largely for electricity. They do not directly compete in terms of prices. For this reason, renewable-energy technologies and usage have grown despite the historically low price of oil, though government subsidies and climate change concerns have played important roles in their development. However, high oil prices have been shown to enhance renewables’ competitiveness and attraction.
With the enhanced improvements in technology, experts believe renewables could capture more of the transport and the non-OECD power market (where fossil fuels are more prominent).9Paul Edwards, “How Fast Can We Transition to a Low-Carbon Energy System?” Renewable Energy World, November 23, 2015, http://www.renewableenergyworld.com/articles/2015/11/how-fast-can-we-transition-to-a-low-carbon-energy-system.html. In this case, high oil prices will enhance renewables’ competitiveness and, therefore, contribute to their success.
How much could the use of renewable energies be accelerated? Solar and wind-power installations are currently emerging faster than any other electric power source. Germany and China have made major commitments to renewables. “Germany now gets over 25% of its electric power from renewables, helping to reduce its total carbon output by over 25% relative to 1990.10Ibid. According to other experts, “renewable sources accounted for nearly one-third of the electricity consumed in Germany in 2015. The country is now the world’s largest solar market. Germany’s carbon emissions in 2014 were 27 percent lower than 1990 levels.” Nevertheless, the variability of those sources forces Germany to keep other power plants running. And in Germany, which is phasing out its nuclear plants, those other plants primarily burn dirty coal. Richard Martin, “Germany Runs Up Against the Limits of Renewables,” MIT Technology Review, May 24, 2016, http://www.technologyreview.com/s/601514/germany-runs-up-against-the-limits-of-renewables/ China already produces more solar electricity than any other country. In Australia between 2010 and 2015, solar photovoltaic capacity grew from 130 megawatts to 4.7 gigawatts—an annual growth rate of 96%.”11Ibid
Technical obstacles include battery storage and smart grids. Current batteries are expensive and slow to recharge. But, experts believe there is reason for optimism. The energy density of batteries—that is, how much can be stored by weight—has improved steadily over the past two decades, and the pace appears to be picking up, with the price of storage down 60 percent in the past decade.12Paolo D’Aprile, John Newman, and Dickon Pinner, “The New Economics of Energy Storage,” McKinsey, August 2016, http://www.mckinsey.com/business-functions/sustainability-and-resource-productivity/our-insights/the-new-economics-of-energy-storage?cid=other-eml-alt-mip-mck-oth-1608.
Several research firms have projected the share of renewable energy in global primary-energy demand in 2035. The projection by Meister Consultants Group for Greenpeace—about 52 percent of global demand—was the most optimistic, and has so far been the most accurate, considering the recent strong growth in the sector.13Meister Consultants Group, “Renewable Energy Revolution,” March 16, 2015, http://www.mc-group.com/the-renewable-energy-revolution/. However, there is significant uncertainty about whether this momentum can be maintained, as the Meister Consultants Group itself notes. This uncertainty partly stems from the Trump Administration’s decision to boost reliance on fossil fuels to emerging economies’ political will and capacity to adopt structurally disruptive projects, as well as questions about continued improvements in the technologies themselves. An ExxonMobil study presents a more pessimistic projection—with renewables, excluding hydropower, accounting for 14 percent of global power demand by 2035.14This study assumes a relatively slow uptake of renewables, and little advancement of global environmental policy. ExxonMobil, “2017 Outlook for Energy: A View to 2040,” http://cdn.exxonmobil.com/~/media/global/files/outlook-for-energy/2017/2017-outlook-for-energy.pdf. The renewable-production assumptions of this study’s scenarios fall between these two extremes.
In either Accelerated Renewables or Constrained Energy, governments and companies would be under enormous pressure to overcome technical and other obstacles to more renewable use, as well as introducing technologies such as smart grid and grid-scale storage to manage the intermittency of renewables.
Middle East OPEC oil production
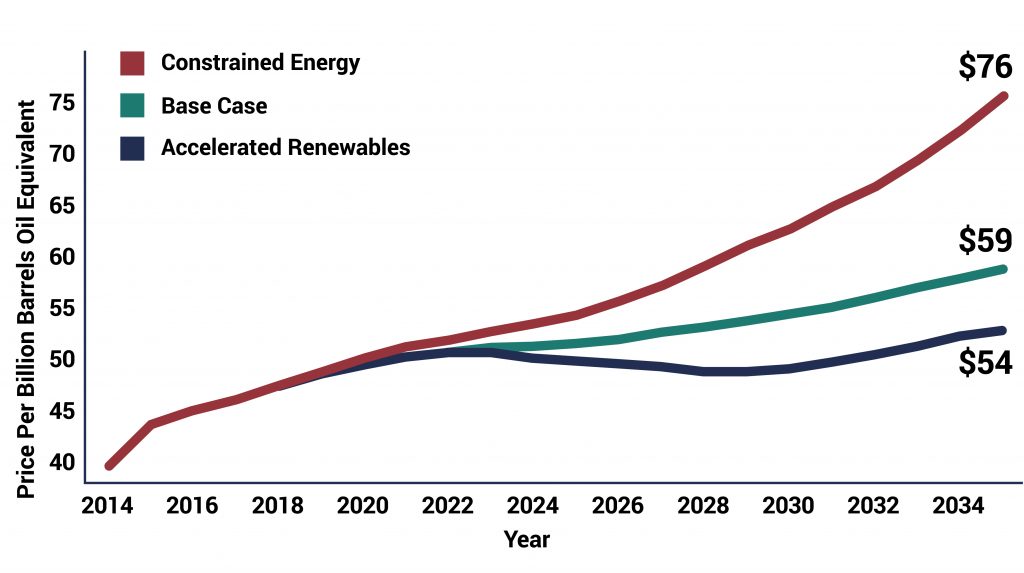
World energy prices
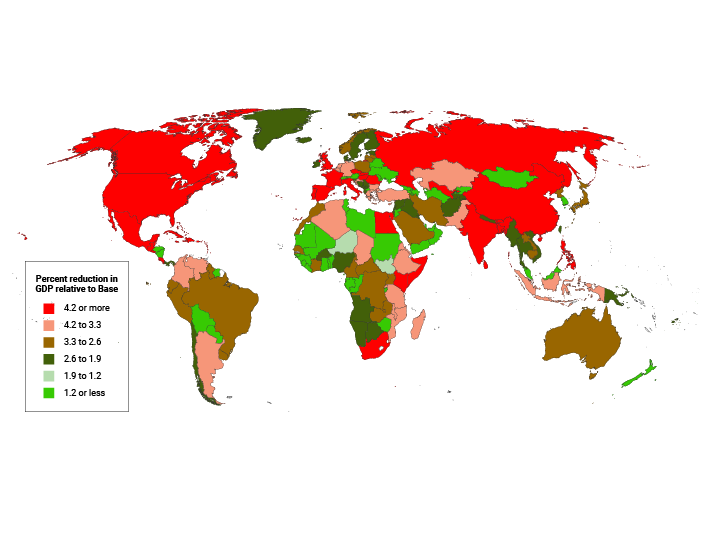
Percent change in GDP in constrained energy relative to the base case in 2035
Major geopolitical implications
Under both scenarios, there is a flattening of oil production among Middle East OPEC countries because of a widening Saudi-Iranian conflict.
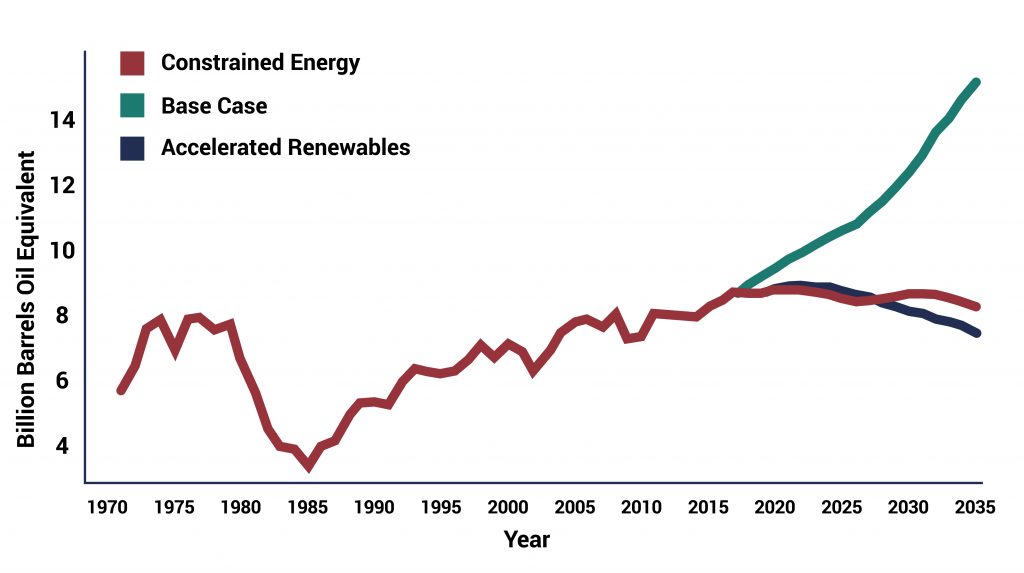
In Constrained Energy, global oil production is reduced by an annual 2.3 billion barrels of oil equivalent (BOE) relative to the Base Case by 2035, or roughly that of current US annual output.15Energy modeled in IFs is standardized across categories using this unit of measurement.
In Constrained Energy, limited production drives energy prices from today’s roughly $46 BOE to more than $76 BOE by 2035 (roughly 29 percent higher than in the Base Case).16The prices reported here are from a basket of energy sources, and reflect dynamic interaction between supply and demand across energy type (coal, gas, hydro, nuclear, oil, and other renewable) for one hundred and eighty-six countries. All prices are real, and do not include estimates of future inflation. Energy-producing countries outside the Middle East would likely institute export bans to ensure domestic consumption needs would be met.
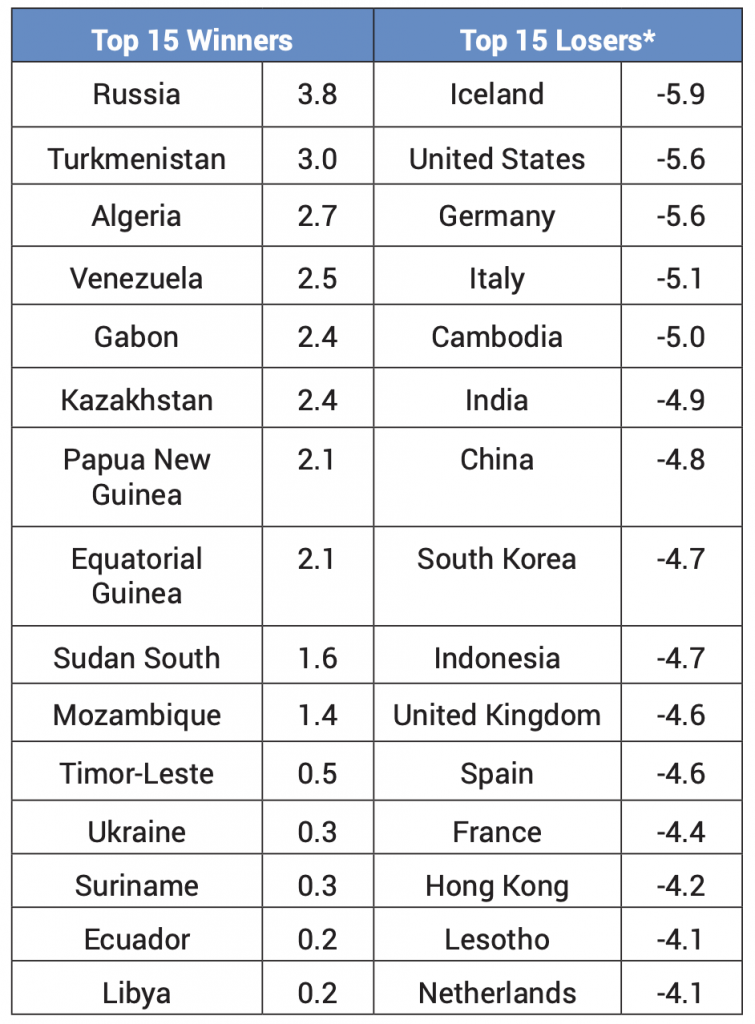
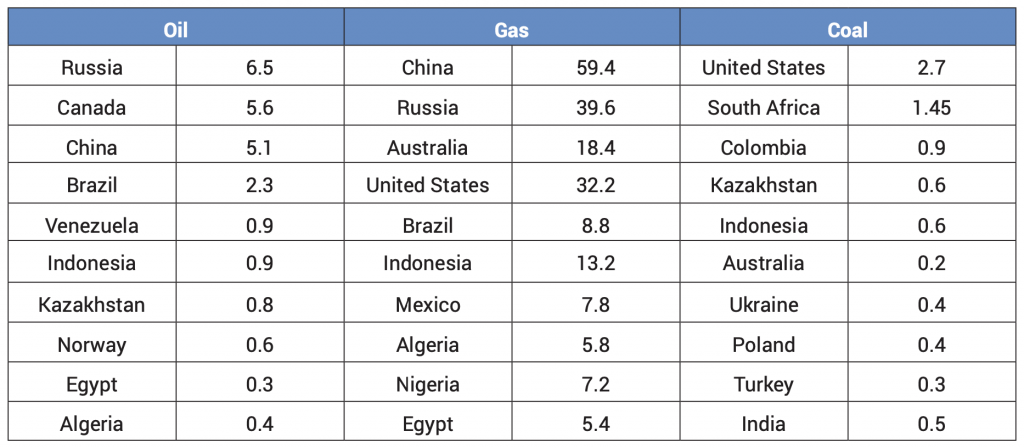
These higher energy prices incentivize greater investment in and production of oil, gas, and coal, and countries with large reserves begin to extract fossil fuel resources that were previously not economically viable to produce. The table on page 18 lists the ten countries that most increase oil, gas, and coal production in a possible Saudi-Iranian conflict. In Constrained Energy, Russia overtakes Saudi Arabia as the world’s largest oil producer, and approaches US levels of total energy production by 2035.
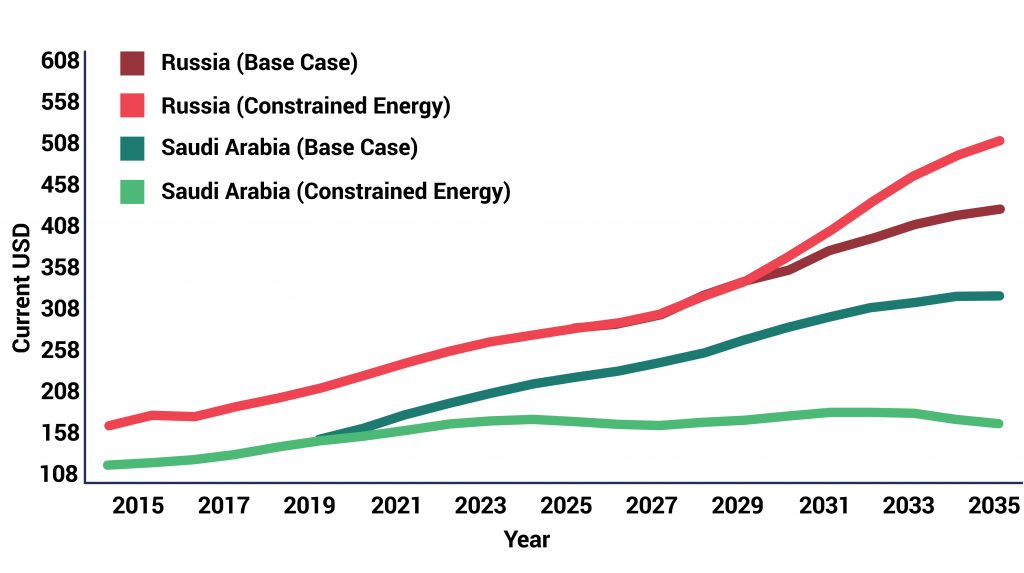
In Constrained Energy, Indonesia overtakes Saudi Arabia as the second-largest energy exporter by 2030; by 2035, Australia does the same. Russia’s dominance as the world’s largest energy exporter grows substantially relative to the Base Case, strengthening Russia’s trade relationships with China (see Energy exports to China chart).
Increased fossil fuel production from other countries and renewable energy sources do not fully offset reduced oil production from the Middle East, and energy trade under Constrained Energy is forecast to fall 3 percent short of that of the Base Case. In many countries, the disruption leads to a significant reallocation of capital toward the energy sector. This disruption ultimately leads to a $54 trillion cumulative reduction in global economic output, relative to the Base Case, by 2035. India, China, and the United States are among those hit the hardest. However, some countries with large energy sectors (relative to the greater economy), such as Russia, Turkmenistan, and Venezuela, enjoy an increase in GDP during the oil crisis.
With limited imports, and constrained renewable uptake, large countries like China and the United States increase energy production (largely oil and gas), but more of this production is consumed domestically, which significantly reduces these countries’ energy exports. Furthermore, to meet surplus demand, countries shift resources toward the energy sector (away from other, more productive, sectors of the economy), undermining the benefits of comparative advantage.
In Constrained Energy, global carbon emissions drop relative to the Base Case for the first few years through the mid-2020s. However, as global markets readjust, and fossil fuel production is scaled up in many countries to offset reduced output from the Middle East, annual emissions reach and surpass those forecast in the Base Case.
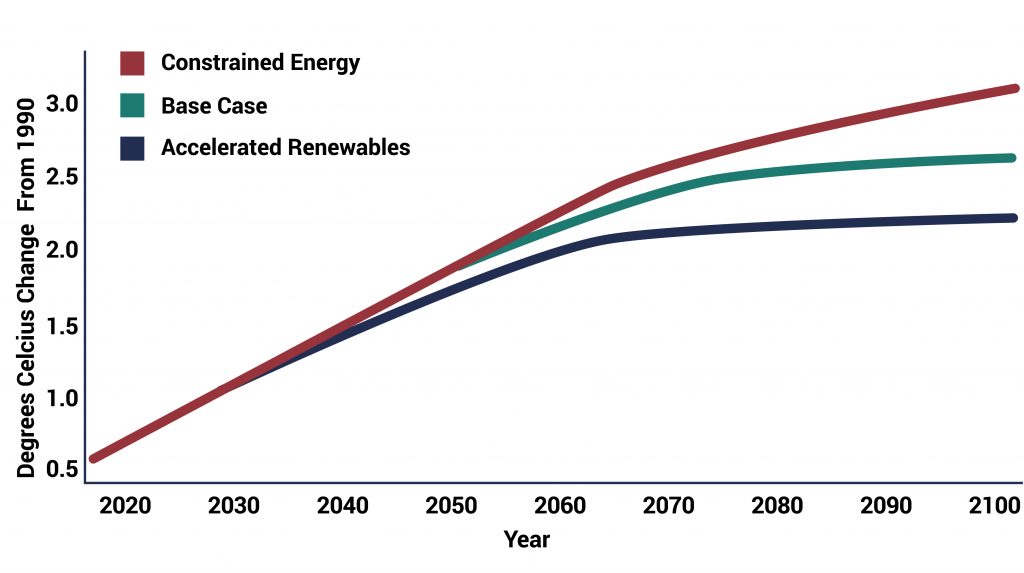
With the more rapid adoption of renewable technology in Accelerated Renewables, nearly all countries reduce their global carbon footprint relative to the Base Case. Carbon emissions in a few major fossil-fuel exporters increase somewhat relative to the Base Case—though other countries, which already have significant renewable production in their energy profiles, see an absolute reduction in emissions by the 2020s. This leads to a cumulative 5.4-billion-ton reduction in global carbon emissions relative to the Base Case by 2035.17The Base Case includes improvements in energy efficiency and an increased investment in renewables, though it does not explicitly assume that all countries meet COP21 targets. In the Base Case, atmospheric carbon dioxide reaches 553 parts per million, and global temperatures reach 2.6 degrees Celsius above 1990 levels by 2100. Scientists estimate that, as of 2016, the world has already surpassed the COP21 target of 400 PPM. Brian Kahn, “The World Passes 400 PPM Threshold. Permanently,” Climate Central, September 27, 2016, http://www.climatecentral.org/news/world-passes-400-ppm-threshold-permanently-20738. The upper graph on page 19 shows the impact of these different scenarios on global temperature change.
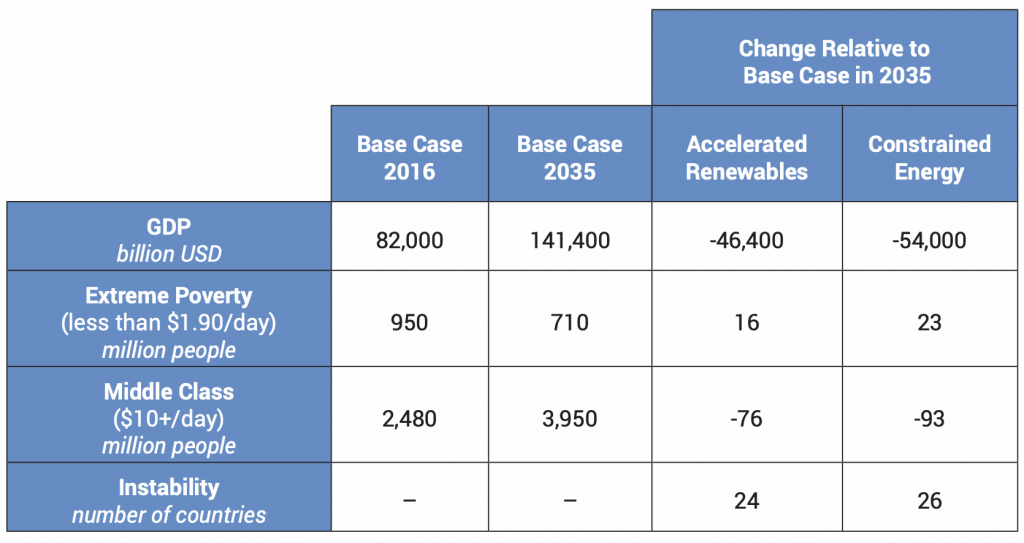
The global economic downturn, driven by higher oil prices, and ongoing conflict in the Middle East would see in Constrained Energy twenty-three million more people living in extreme poverty (on less than $1.90 per day), fifty-two million more people living on less than $3.10 per day, and thirty-eight million more people vulnerable to poverty (between $3.10 and $10 per day), compared with the Base Case. At the same time, the size of the population living on more than $10 per day contracts by ninety-three million people relative to the Base Case. Furthermore, in a future of higher energy prices, more than twenty countries experience a higher probability of domestic instability.
If, however, renewable technology drives down the cost of alternative-energy production, and/or social and political pressures promote greater investment in clean energy, a Saudi-Iranian conflict severely diminishing oil output may have a somewhat lessened negative impact on the global economy. In Accelerated Renewables, a shift toward renewables requires a greater upfront investment, though the payoffs help to mitigate some of the economic impacts of the oil crisis in the long run. Early on, energy trade falls as countries consume more domestically, though global production is eventually able to fully offset the reduction in oil production from the Middle East. Energy prices rise in the short term, as markets work to readjust, but they begin to hold steady by the mid-2020s. By 2035, the global energy-production profile is significantly different between the two scenario variants of Constrained Energy and Accelerated Renewables.
Top 10 largest increases in energy production by 2035
Temperature change from CO2
Energy exports to China
The global economy is still significantly diminished relative to the Base Case (a cumulative $46 trillion difference) in Accelerated Renewables, but with greater renewable production and investment, global GDP is a cumulative $8 trillion greater than in a scenario with slower renewable uptake. In countries like the United States, increased renewable consumption can allow for higher levels of energy exports. In the Base Case, the United States is the sixth-largest energy exporter by 2035. In Accelerated Renewables, it becomes the fourth-largest exporter. Similarly, countries that benefit the most relative to the scenario, with slower renewable uptake, are typically those that had higher levels of energy-import dependence.
Poverty and the middle class still suffer relative to the Base Case, with sixteen million additional people living in extreme poverty, forty-one million people living on less than $3.10 per day, and seventy-six million fewer people living on $10 or more per day. However, relative to the scenario with limited renewable investment, there are seven million fewer people living in extreme poverty, twelve million fewer people living on less than $3.10 per day, and seventeen million additional people in the global
middle class and above.
Global energy production profile
Risk management implications
The fact that the effects would be so severe in both Constrained Energy and Accelerated Renewables is a reminder that the world remains highly vulnerable to energy losses in the Middle East. Even if a large scale conflict in the Middle East does not occur, there are major planetary benefits to be derived from more energy efficiency, development of renewables and less reliance on fossil fuels.
The growing supplies of conventional and non-conventional energy supplies elsewhere make diversification a more attainable goal for countries dependent on Middle East oil. Designing an energy security strategy should also weigh the energy requirements of the country’s production, business production types, production and distribution footprint and the need for companies to be prepared to localize supply chains with the growing protectionist risk. Scenario-based planning would be important in assessing the different options for boosting energy security.
Companies operating in regions highly dependent on outside energy supplies such as Asia are particularly vulnerable to energy disruptions. Current and future company investment in such markets should take into consideration possible energy disruptions as well as other political risks.
In Constrained Energy, many of the countries that are likely to see additional investment in the energy sector are also some of the riskiest. Investors can use any number of approaches to mitigate the political risk including political risk insurance, co-investing with well-established local partners and/or partnering with international financial institutions such as the International Finance Corporation.
Globally, renewables cannot be accelerated to completely offset the losses from the Middle East. But individual countries have a better chance. The rapid development of renewables underway in many countries means they will be already better prepared for a global energy crisis.
Better energy efficiency is another way to bolster energy resiliency and sustainability. For example, California has managed to keep its energy flat on a per capita basis while national US consumption has doubled through better energy efficiency.
However, investment in reliable transmission and distribution systems are critical as well. For renewable energy projects the feedstock (e.g. the wind) is often located far from the demand. Without a reliable transmission grid the energy can’t be delivered to where it is most needed.
Buildings account for over 40 percent of the world’s energy demand and 71 percent of electricity use. Green buildings can reduce the amount of energy (and water) that buildings consume while maintaining or improving the services. The green building idea has rapidly becoming a global norm so the market opportunities for companies are immense.
An increasing oil price can also have a significant impact on the economics that lie behind global supply chains, such as transport costs. It is important that companies consider this in decisions around the optimization of their supply chains.
III. Water and food scarcity: already a major risk
Driven by increasing populations and middle-class incomes, water scarcity is already—and will continue to be—a major global geopolitical risk.18World Economic Forum, Global Risks Report 2017, p. 13, http://reports.weforum.org/global-risks-2017/. Environment-related risks—including water crises—have been consistently featured in the past seven editions of the report. Compounded by climate change and more extreme weather events, water scarcity and related food insecurity could lead to more domestic instability. The International Organization for Migration (IOM) estimates there are now several million “environmental migrants,” and that this “number will rise to tens of millions within the next 20 years, or hundreds of millions within the next 50 years.”19Jacob Park, “Environmental Migrants: More than Numbers,” Our World (blog), July 13, 2011, https://ourworld.unu.edu/en/environmental-migrants-more-than-numbers. Droughts have already contributed to conflicts, including the current crises in Syria and Sudan.
Water scarcity is a “risk multiplier,” creating additional related problems. In water-scarce conditions, for example, upstream countries have sometimes denied downstream consuming nations by damming a shared river, increasing the potential for agricultural failure and conflict. In the Syrian case, the multiyear rural droughts and associated crop failures prompted large-scale internal migration to urban centers. The large numbers of new urban poor helped ignite the civil conflict.
Water scarcity does not have to lead to conflict or instability. There are many examples of countries cooperating to forestall a conflict. Characteristics that make water-based conflict more likely include: the degree of scarcity, the extent to which the water supply is shared by more than one region or state, the relative power of the basin states, and the ease of access to alternative freshwater sources.
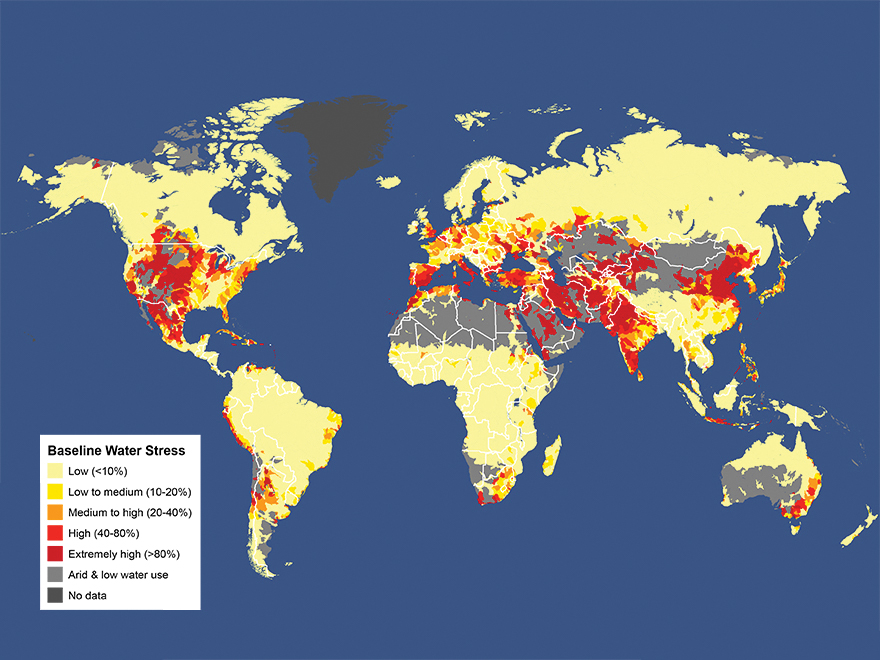
Water scarcity will become increasingly severe regionally and, to a less-rapid extent, globally by 2035. Global-level scarcity isn’t predicted until at least after 2050, and this projection takes into account the additional burden of reforestation.20J. Rockström, M. Falkenmark, M. Lannerstad, and L. Karlberg, “The Planetary Water Drama: Dual Task of Feeding Humanity and Curbing Climate Change,” Geophysical Research Letters vol. 39, no. 15, http://onlinelibrary.wiley.com/doi/10.1029/2012GL051688/full. Climate change will lead to increases in precipitation variability, meaning more extreme cycles of flooding and drought in semiarid and arid regions. Increases in severity of drought, and decreases in precipitation predictability and snowmelt flows (due to reduced accumulation potential), are expected in arid and semiarid regions of the southwest United States, Southern Europe, Australia, Africa, and the Middle East. Increases in severity and disruption in the timing of flooding cycles have the potential to be increasingly economically disruptive, especially for poor countries.
A 40 percent increase in the number of people living under absolute water scarcity (less than five hundred square meters per capita per year) worldwide can be expected as the two-degree-Celsius global warming “threshold” is passed. This will most likely be experienced in areas already severely affected by water scarcity.21Jacob Schewe, Jens Heinke, Dieter Gerten, Ingjerd Haddeland, Nigel W. Arnell, Douglas B. Clark, Rutger Dankers, et al., “Multimodel Assessment of Water Scarcity under Climate Change,” Proceedings of the National Academy of Sciences vol. 111, no. 9, pp. 3245–50, doi:10.1073/pnas.1222460110.
Overuse of water-table resources continues to be a significant global problem. The resulting increase in saline content of such overused water resources can produce a significant decrease in crop yield when this water is used for irrigation.
Our scenarios
Three scenarios are examined. In the Base Case, global water withdrawals are forecast to increase by 14 percent above current levels. In Arid Earth, exploitable water resources are reduced by 60 percent by 2035. In Severe Weather, weather patterns are increasingly volatile and erratic, leading to more frequent droughts, flooding, and soil erosion, and more variability in crop yields.
The Base Case already constitutes a geopolitical risk, as many of the most affected countries—such as those in parts of Africa, the Middle East, and South Asia—lack resources and good governance to implement solutions. Even in those countries with more means to cope with water insecurity, economic growth is constrained (mainly in the manufacturing and agricultural sectors), and dependence on food imports increases.
- In the Base Case, water demand increases by 14 percent compared to current levels; demand is forecast to be met largely through renewable freshwater resources (surface and ground).
- Desalinated water will increase its share of total supply, but remain below 3 percent until 2035. This could cost as much as $31 billion.22Cumulatively, assuming the average cost through 2035 remains similar to the global average cost of desalination today.
- Dependence on agricultural imports for the Middle East and North Africa will increase from 29 percent to more than 43 percent by 2035, making higher food prices likely.
- The Americas would continue to be a large net exporter of agriculture.
- Agricultural trade between Eastern Europe including Russia, parts of Africa, and southern Asia increases, establishing a more closely knit community within the agricultural trade network. Western Europe also strengthens ties with agricultural producers throughout the African continent.
In a world with increased water scarcity (Arid Earth), reduced supply and slow advances in technology increase the number of countries facing acute instability pressures, driven by water shortages and greater vulnerability to higher food prices. This is a world in which geopolitical risk expands and new security challenges emerge. In Arid Earth, many more countries—including developed countries, and practically all regions of the world—would be affected.
Severe Weather would also see the risk of political instability and economic degradation, but the weather variability would likely incentivize all governments to build up their resilience through greater investments in agriculture. Some scientists believe extreme weather events are happening more frequently than were forecast a decade or so ago. In 2011, for example, scientists noted that “the observed heat wave intensities in the early 21st century already exceeded the worst-case projections of climate models.”23Daniel Huber and Jay Gulledge, Extreme Weather and Climate Change (Washington, DC: Center for Climate and Energy Solutions, 2011), https://www.c2es.org/publications/extreme-weather-and-climate-change. Also see the 2017 Global Risks Perception Survey where extreme weather was rated as highly likely over a ten years horizon. http://www3.weforum.org/docs/GRR17_Report_web.pdf.
Summary for the water scarcity variants
Areas of water stress
Major geopolitical implications
In all the scenario variants, water scarcity and food insecurity increase, reducing economic growth, increasing poverty, and potentially leading to more domestic instability, including conflict and forced migration.
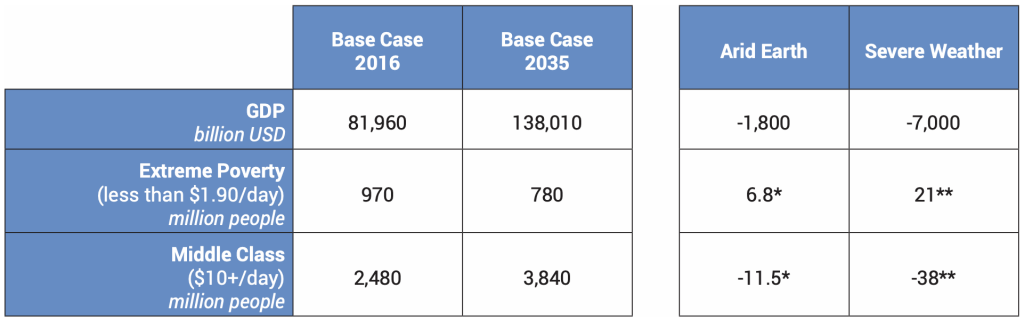
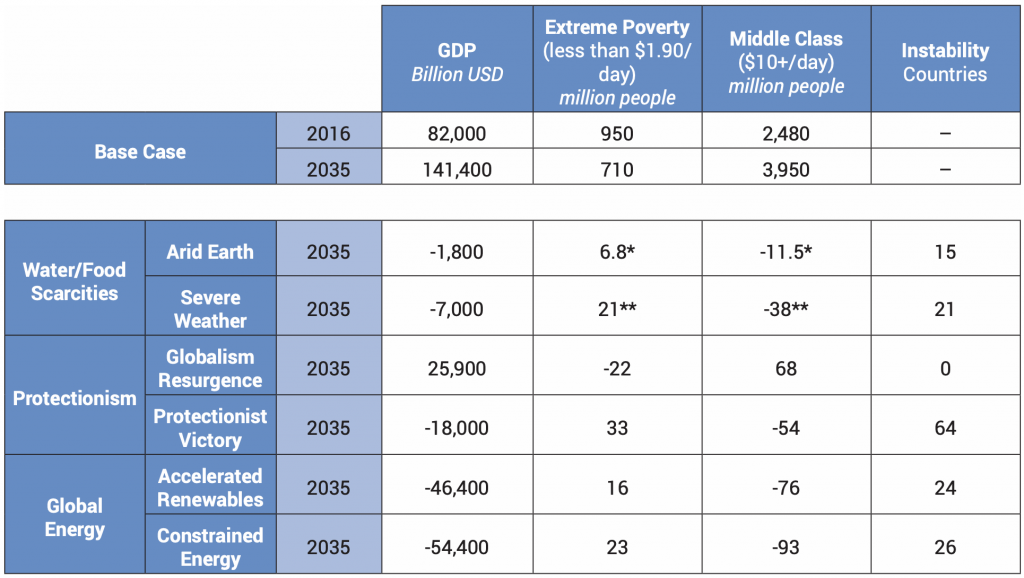
In Arid Earth, total GDP would be reduced to a cumulative $1.8 trillion by 2035, relative to the Base Case. In countries particularly harmed by increasing water scarcity, the number of people living on less than $1.90 per day increases by 6.8 million, and the number of those living on more than $10 per day is reduced by 11.5 million.
In South America, net crop exports increase to more than 20 percent of demand, compared to 15 percent in the Base Case. Cropland expansion leads to deforestation of about 3.3 million hectares, an area larger than Belgium. The global agricultural trade networks become increasingly dense, as trade becomes increasingly necessary to offset the negative impacts of decreased yields.
Severe Weather is a future in which more severe and erratic weather leads to more volatile crop yields globally. To compensate for lower yields, ten million hectares of forest would have to be converted into cropland. Despite this, there still would be a cumulative 1.4 billion fewer metric tons of overall crop production, and a cumulative $550 billion less in global exports. During the years of greatest crop failure, food insecurity is forecast to lead to forty million additional people living in hunger, thirty-eight million additional people living in poverty, and twenty-one million additional people living in extreme poverty. Between ten million and thirty-three million fewer people would be in the middle class (living on between $10 and $50 per day) during the 2030s. In the peak year for yield loss, thirty-eight million people fall into a state of economic vulnerability (living on less than $10 per day).
Due to the increased investment necessary to mitigate highly inconsistent crop yields, a cumulative $40 trillion of capital is diverted to agriculture from other sectors of the economy, contributing to a cumulative decrease of almost $7 trillion in global GDP. The increased investment could, however, have a beneficial effect over time, leading to greater resilience to water and food shocks in some countries.
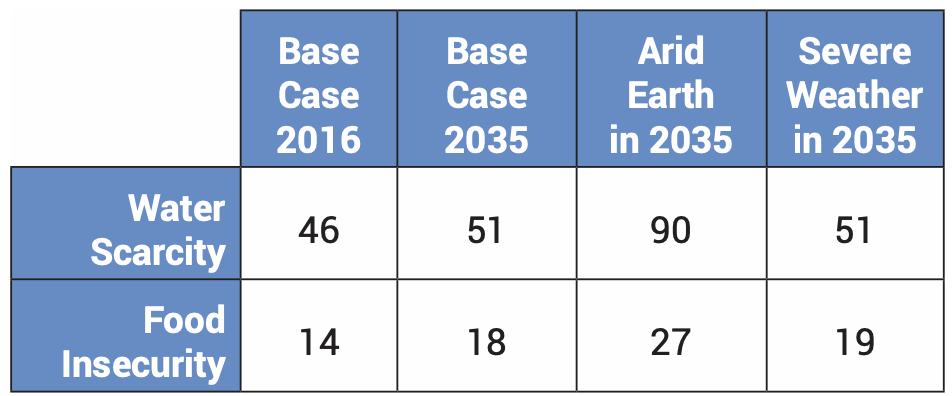
Potentially, the biggest effects are seen in the number of countries that would experience water scarcity, particularly in Arid Earth. Currently, forty-six countries already face national water scarcity and fourteen countries import more than 75 percent of food for consumption. In the Base Case to 2035, fifty-one countries are forecast to struggle with water scarcity at the national level, while eighteen countries are forecast to import more than 75 percent of their food demand.
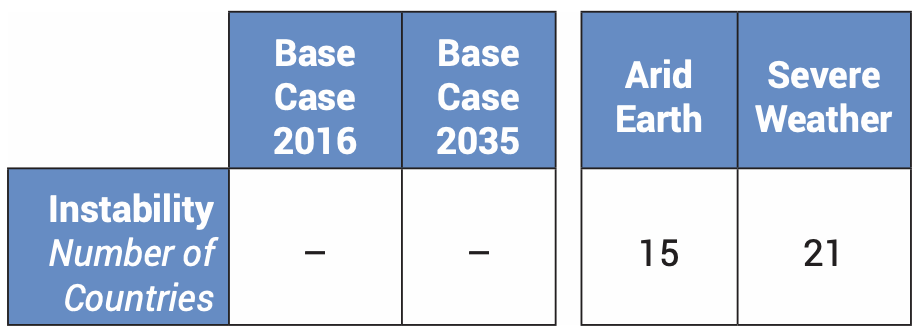
Under Arid Earth, the number of countries experiencing water scarcity and food insecurity is forecast to expand to ninety and twenty-seven, respectively, and domestic instability expands to fifteen additional countries.
Under Severe Weather, water scarcity and food insecurity do not affect as many countries due to increased agricultural investments by some countries, but the growing variability increases the likelihood of domestic instability for those that are affected. An additional twenty-one countries, a number larger than the fifteen in Arid Earth, will experience instability.
The 2008 global food crisis—a factor in the 2011 Arab uprisings—can help explain this paradox. Leading up to that crisis, international wheat and maize prices had doubled in the space of two years, and rice prices tripled within a matter of months. Worldwide food riots broke out, with the Middle East especially hard hit. Many countries there, such as Egypt, are highly dependent on imported food.
There have been food price spikes in 2011 and 2013, but the adverse impacts have been less severe, “largely because many developing countries had increased their cereal production since 2008, had reduced their import bills, and fuel and fertilizer prices were at lower levels than in 2008,” according to the World Bank.24World Bank, “Global Food Crisis Response Program,” April 11, 2013, http://www.worldbank.org/en/results/2013/04/11/global-food-crisis-response-program-results-profile. Nevertheless, many countries remain susceptible to food crises. The UN Food and Agriculture Organization (FAO) particularly identifies regions and countries characterized “by recurrent natural disasters and/or conflict” and “insufficient institutional capacity” as vulnerable to instability from another food crisis.25Cordaid, “Food Security in Fragile Contexts,” June 18, 2015, https://www.cordaid.org/en/news/food-security-fragile-contexts/.
With the increasing frequency of extreme weather events, future food production is at higher risk, increasing the potential for bigger food price spikes than in 2008, and putting pressure on countries lacking the ability to cope. Of the major grain groups (wheat, maize, rice, soya bean), 30 percent or more of each grain’s production occurs in regions experiencing extreme water stress.
Number of countries experiencing water scarcity and food insecurity
Increased instability
Risk management implications
Governments can mitigate some of the worst effects of water scarcity. During recent droughts in California, federal and state providers curtailed water supplies to farmers and the price of available water soared 10 times. Denmark has instituted full cost recovery for urban water consumers, which resulted in consumers having one of the lowest levels of water demand in the developed world. The introduction of water pricing in other countries where water is relatively cheap could have an immediate impact in lessening scarcity. Farmers in many developing countries currently have little incentive to conserve. The needs of the poor need to be protected so that water pricing does not deprive them of access. NGOs can instruct poor farmers in ways to conserve water, including helping them invest in low cost water-saving technologies. In rural areas, expanding crop insurance programs can protect farmers against rainfall shocks.
Greater agricultural investments in drought-resistant and heat tolerant crops would mitigate some of the worst impacts. For example, new varieties of pearl millet, the most inherently drought-tolerant of all the major staples, together with sorghum, are increasingly being planted in the drylands of southern Africa.
Desalination and wastewater treatment are tried and tested technologies for mitigating water scarcity that even now are undergoing rapid technological improvement. Desalination is still expensive so foreign investment in such a technology for poorer, developing countries would be needed if water scarcity is to be avoided. Desalination is only feasible with large supplies of available seawater and even in some of these cases, needed transport over long distances may not make it a feasible investment.
Flood hazards are projected to increase in more than half the world’s regions, according to the World Bank. Many of Asia’s biggest cities are built in low-lying areas, making them very vulnerable to flooding and sea-level rise. Companies need to think about potential threats to owned assets and critical supply chain assets from flooding. With new investments, companies need to be careful with choosing places where risks are increasing for water scarcity and flooding.
Better urban planning can reduce the exposure of cities to flood risk. Construction of seawalls, levees, and dams can protect coastal cities from storm surges and floods.
For companies, increasing water insecurity opens opportunities to develop lower cost technologies that increase food production using less water. In the United States, meat consumption alone accounts for a 30 percent of the country’s water footprint. Beef, for example, requires 1,847 gallons per pound.
Conclusion
In comparing the scenarios, the energy crisis—involving massive cuts to available energy—would have the biggest negative impact on global GDP in Constrained Energy, in which Middle Eastern energy production flattens, reducing world supplies. Compared to the Base Case, there is a cumulative decrease in global GDP of $54 trillion. Even in Accelerated Renewables, global GDP loses more than a cumulative $46 trillion by 2035.
Protectionist Victory could see an appreciable, but smaller, impact of $18 trillion compared to the Base Case. However, the loss is more substantial if compared with what could be achieved in Globalism Resurgence; the potential loss is almost $44 trillion.
The 2000 UN Millennial Development Goals26http://www.un.org/millenniumgoals/bkgd.shtml called for halving extreme poverty and hunger rates by the end of 2015, and achieved that objective five years earlier. The UN’s 2016 Sustainable Development Goals want to eradicate extreme poverty everywhere by 2030. This study’s Base Case for 2035 suggests meeting that goal will be difficult. Protectionist Victory would add the most people—thirty-three million—to the ranks of those in extreme poverty, while Constrained Energy and Accelerated Renewables would see an additional twenty-three and sixteen million, respectively. Arid Earth and Severe Weather would see the smallest additions, but the numbers are nevertheless significant—6.8 and 21 million more people, respectively—would be added to those in extreme poverty.
The expansion of the middle class was also a big achievement of the past several decades. Constrained Energy would see the largest number—ninety-three million people—drop out of the middle class, followed by Accelerated Renewables (seventy-six million) and Protectionist Victory (fifty-four million). Severe Weather (thirty-eight million) and Arid Earth (11.5 million) would also see declines in the global middle class.
Protectionist Victory sees an especially large number of countries falling into instability, driven by a breakdown of the international trading system. With the loss in growth, countries could see sharp reductions in health spending, education spending, and infrastructure spending, making instability more likely (as a snowball effect).
The Protectionist Victory and Global Energy scenarios demonstrate the close linkages between trade and growth, and their impacts on poverty and middle-class levels and instability. Trade encourages growth, and a breakdown in trade—whether from protectionist policies or a shutdown in energy supplies—lowers the growth potential.
But, the Water and Food Scarcity Scenario poses a different kind of threat because it is already happening. Even in the Base Case, the number of countries (currently sixty, rising to sixty-nine in 2035) experiencing water scarcity and food insecurity is high. Today’s water and food scarcities are a significant factor in why there are millions of people living in poverty, and why extreme poverty won’t be completely eradicated by 2035 despite continued economic growth in the Base Case. For example, the World Bank’s study of climate change and eradication of poverty found that many more poor people than rich people are exposed to droughts, higher temperatures (which are often detrimental to agricultural yields), natural disasters, and, to a lesser extent, rivers flooding. Their pre-existing exposure to these conditions makes it harder to move out of poverty.
The figures of 6.8 and 21 million additional impoverished people in Arid Earth and Severe Weather respectively measure how many more people in negatively impacted countries become impoverished. While some countries in less vulnerable positions are able to produce and export more food, becoming more central in global networks of agricultural trade, the gains in these countries do not offset the economic losses felt by the rest of the world.
Global GDP losses are relatively restrained compared to the other scenarios, because the biggest losses would be in poor countries on the margin of the world economy. By contrast, China—which also suffers severe water shortages—has shown it has the political will and means to try to overcome the potential challenges outlined in the scenarios. The World Bank, in fact, believes China could boost growth 2 percent per year by 2050 if it adopts efficient water policies.
While the number of potentially unstable countries was smaller, Syria and Sudan have already experienced what the effects of drought can produce. Instability was not contained in either case, and led to dangerous regional, if not global, threats.
Geopolitical risks are, by their nature, difficult to shape, because they are driven by forces beyond the control of companies or single governments. Nevertheless, in view of the growing geopolitical volatility, companies need to examine the disruptions that could result from these scenarios.
In companies, responding to geopolitical and environmental risks needs to start at the highest levels. As well as taking measures to manage and mitigate short-term disruptions, sustainable businesses will need to create frameworks that support longer-term enterprise resilience. Building an enterprise-resilience framework will help actively manage the downside, and upside, of geopolitical risks
Companies with existing or prospective exposure in these areas are becoming more aware that they need a systematic way of assessing and mitigating the risk, and political risk insurance is one tool they can use to protect them from potentially catastrophic losses in a particular country or across multiple ones.
With risks come opportunities, and companies that weigh both will be in a better position to weather the upcoming storms.
Governments bear more responsibility and must step in to prevent the worst cases from happening. In the long term, all end up worse off if events are allowed to take their course. High levels of sovereign debt, negative interest rates, and political capacity and will are important considerations in thinking about the specifics risks and how they can be mitigated.
Key takeaways
- Geopolitical volatility will be a key driver of uncertainty over the next few years.
- Geopolitical risks are interrelated, so understanding the connections is a vital step in managing risk and avoiding surprises.
- Boards and risk managers must consider the potential impact of geopolitical risks on their financial and physical assets, operations including supply (value) chains, and people.
- Effective risk management requires companies to take into account the interdependencies between risks, and more than ever demands a truly holistic risk management approach.