by Dan Negrea and Matthew Kroenig
We are in the throes of the greatest geopolitical debate since the fall of the Berlin Wall. On one side is the model of autocratic capitalism championed by China; on the other, the ideal of democratic capitalism espoused by the United States and the free world. It’s a debate that revolves around hugely consequential questions, especially among developing countries: Which type of system yields the best results for its people? Which should other countries emulate? As US President Joe Biden, who seems acutely aware of this contest of ideas, put it in his address to the United Nations General Assembly in September, one of the challenges of our times is to “prove democracies can deliver for their citizens.”
The inaugural Freedom and Prosperity Indexes, which the Atlantic Council’s new Freedom and Prosperity Center unveiled this summer and which synthesize reams of data about nearly every country, show that democracies do indeed deliver. We believe our indexes offer an essential tool for answering such burning questions now and in the years to come. They strip emotion and politics from a debate that too often resides in the lofty realm of political philosophy or becomes infused with matters of morality or even patriotic pride. We think it’s time to reset the terms of the debate by letting the data do the talking—to quantify the discussion and ground it in facts. And the indexes have a lot to tell us. They reveal the most effective ways for governments to invest in their most important resource: their people.
Our data, which draws from and builds on the invaluable work of several other country indexes, suggests that the best path to prosperity is the same across the world: through political, economic, and legal freedoms. Citizens in countries ranked as “Free” are thirteen times as wealthy as those in “Unfree” countries, according to our indexes. And that’s not the only way they’re prospering. They’re also happier, healthier, and part of more inclusive societies—all in tangible ways that we can measure.
To investigate which type of government does a better job of promoting prosperity, we have developed a new framework that examines the relationship between prosperity and freedom in the 174 countries for which we have comparable data. We compiled that data from available sources at the end of 2021, so it is more of a snapshot in time than a real-time reflection of the latest news developments. (We collected it, for example, before Vladimir Putin’s further invasion of Ukraine earlier this year and his related crackdowns at home, so the numbers don’t capture the blows to freedom and prosperity that Russia has suffered as a result of its military adventurism.) But we nevertheless believe that our research offers as complete an initial picture as possible for such a wide-ranging assessment, and we will be updating the data annually. We first created two unique indexes, one for freedom and the other for prosperity, and then measured the relationship between them. Are citizens in freer countries also more prosperous? Or do authoritarian countries provide more prosperity?
The answer, in this moment, couldn’t be more urgent. And, based on the results of our study, we believe that answer is clear. We found a high correlation between our Freedom Index and our Prosperity Index, indicating that freer countries tend to be more prosperous. And we have reason to believe, based on the trajectory of the results over time along with other historical evidence, that improvements in freedom will eventually lead to greater and more durable prosperity.
We hope that our indexes will inform agents of change in developing countries—government officials, thought leaders, journalists, and engaged citizens—as they weigh their options. We appreciate the difficult decisions they must make. The answers to the debate over freedom versus autocracy, after all, seem far less clear today than they once were.
Back in 1991, in light of the Soviet Union’s collapse at the end of the Cold War, it seemed obvious to many observers that free societies were the only credible systems for organizing markets and politics. Yet the march toward a freer and wealthier world appeared to come to a halt when the 2008 financial crisis started in the United States and spread to other countries. The crisis called into question the ability of free markets to provide the stability and prosperity they promised. And while the United States and its allies and partners have since recovered, the revival took years and was uneven across countries. In the United States and Western Europe, populism has taken hold, political polarization has increased, and public trust in democratic, capitalist institutions has declined. Meanwhile, in developing countries, many people have grown dissatisfied as reforms to allow for more political and economic freedom have failed to translate quickly enough into prosperity. Examples abound of democratic countries backsliding.
At the same time, China has offered a different path. The record-setting economic growth that followed Deng Xiaoping’s economic and political reforms in 1978 continued after 2008. As it asserts its power, Beijing has offered aid and counsel to developing nations around the world, pitching its alternative model of authoritarian capitalism.
Yet even China’s apparent success looks less certain in the cold glare of our data. The country’s economic advances resulted from a period of reform and increased, if still limited, freedoms. As the current government reverses course on those reforms, however, economic growth is slowing. China, in fact, fares remarkably poorly in our prosperity rankings, trailing countries such as Cuba and Russia.
Repeatedly in our data, we see countries that have made moves toward more freedom over time, such as South Korea and Taiwan, scoring well in our prosperity ranking. Many of those that have moved away from freedom, such as Venezuela, lag behind on prosperity.
Put simply: What our data shows should be heartening to those of us who hold freedom as an ideal.
I. Breaking down the big findings
Our analysis revealed a strong 0.81 correlation coefficient between our Freedom Index and our Prosperity Index; high values of Freedom are associated with high values of Prosperity, and low values of Freedom are associated with low values of Prosperity. Another statistical measure, R2, shows that 66 percent of the variation in Prosperity scores around the world can be explained by variation in Freedom scores.
Citizens in countries categorized as Free are five times as rich in terms of income per capita as citizens in countries that are only Mostly Free and six times as rich as those in Mostly Unfree countries.
But we don’t define prosperity in the form of economics alone. Measures of health, happiness, the environment, and minority rights all improve as a country moves toward greater freedom. These results suggest that more freedom is associated with a better quality of life for the average person.
Descriptive statistics across Freedom Index categories
| Category | Country counts | Freedom Index | Population covered | GNI per Capita (US$) | Health Score | ||||||||
| Mean | Median | Mean | Median | Mean | Median | Mean | Median | ||||||
| Global | 174 | 56.7 | 55.7 | 7,686 | 100% | 13,312 | 5,070 | 62.2 | 67.2 | ||||
| Free | 41 | 83.2 | 82.3 | 1,131 | 15% | 36.142 | 32,290 | 87.5 | 89.9 | ||||
| Mostly free | 67 | 60.8 | 59.7 | 2,824 | 37% | 7,246 | 7,246 | 60.6 | 65.9 | ||||
| Mostly unfree | 55 | 39.7 | 40.5 | 3,570 | 46% | 5,791 | 5,791 | 49.1 | 47.1 | ||||
| Unfree | 11 | 18.3 | 18.9 | 157 | 2% | 2,775 | 2,775 | 43.7 | 42 | ||||
Continued: Simple statistics across Freedom Index categories
| Category | Country counts | Environment Score | Happiness Score | Minority Rights Score | Prosperity Index | ||||||||
| Mean | Median | Mean | Median | Mean | Median | Mean | Median | ||||||
| Global | 174 | 45.4 | 46.1 | 62.2 | 56.1 | 79.1 | 87.6 | 51.2 | 49 | ||||
| Free | 41 | 80.7 | 89.2 | 79.4 | 78.4 | 94.6 | 95.9 | 76.9 | 79.1 | ||||
| Mostly free | 67 | 38.7 | 41.6 | 52.1 | 52.4 | 85.3 | 88.9 | 48.2 | 47.7 | ||||
| Mostly unfree | 55 | 30.4 | 27.1 | 47.0 | 45.3 | 66.7 | 70.0 | 40.0 | 38.3 | ||||
| Unfree | 11 | 29.4 | 29.5 | 27.5 | 22.6 | 47.6 | 45.6 | 30.5 | 31.3 | ||||
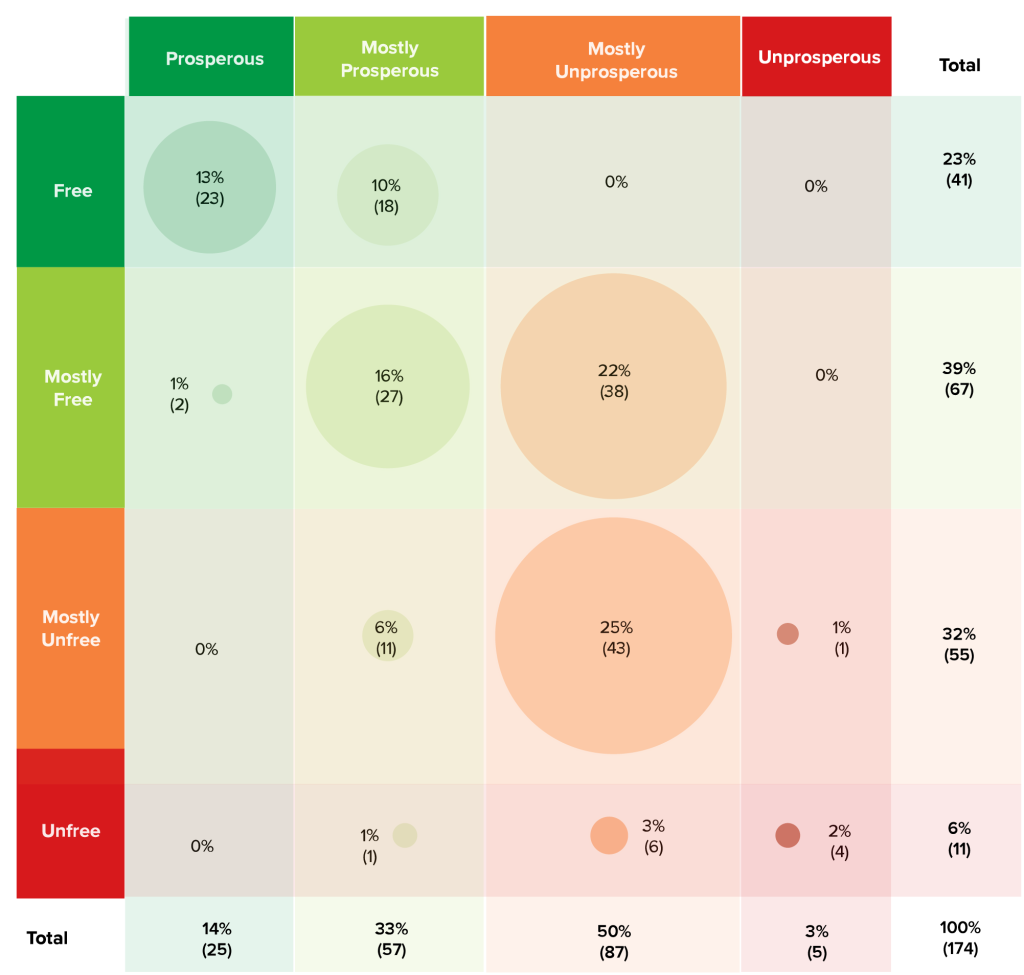
The data also indicates that autocracies generally do not deliver broad-based prosperity for their people. All countries rated Prosperous in our index also rank as Free except for Singapore and Israel, which occupy the two highest positions in the Mostly Free category. All countries in our Free category fall in either the Prosperous category or in the upper half of the Mostly Prosperous category. Despite its decades of economic growth, to cite one example, China shows only middling results on our Prosperity Index, ranking 114th and Mostly Unprosperous. In addition, all Unfree countries in our Freedom Index rank in the Mostly Unprosperous or Unprosperous categories in our Prosperity Index—except for Cuba, which scores relatively well on some measures such as Health.
Overlap between freedom and prosperity categories
In an effort to disentangle the nature of the relationship between freedom and prosperity, we constructed the same Freedom and Prosperity Indexes going back in five-year increments for the years 2016, 2011, and 2006, with the latter the earliest date for which data on our indicators was available. We then examined whether measures for Freedom in prior years are associated with levels of Prosperity in subsequent years. After all, changes in prosperity do not happen overnight. If freedom drives subsequent prosperity, then we should see the correlations between Freedom in prior years more strongly associated with levels of Prosperity in subsequent years.
This is indeed what we found: The longer the time lapses between our measures of Freedom and Prosperity, the stronger the association. A country’s level of Prosperity today is better explained by its level of Freedom in 2006 than by its current level of Freedom. While the relative differences may seem small, they are in a consistent direction. This rough test does not provide definitive proof that advances in freedom produce subsequent prosperity, but it is suggestive of such a dynamic and worthy of further investigation.
Historical correlations
| Prosperity 2021 | |||
| Freedom Index Year | R2 | Slope | Simple Correlation |
| 2021 | 0.656 | 0.762 | 0.810 |
| 2016 | 0.662 | 0.771 | 0.814 |
| 2011 | 0.673 | 0.809 | 0.821 |
| 2006 | 0.677 | 0.834 | 0.823 |
Note: The table is based on the results of simple ordinary least squares regression, in which Prosperity Index 2021 is the dependent variable and time series of the Freedom Index are the explanatory variables.
Evidence suggests that freedom contributes to prosperity
We also tested the alternative hypothesis. Are past levels of Prosperity more strongly associated with current levels of Freedom? While there is a relationship, it is weaker than the link between Freedom and subsequent Prosperity, suggesting that the relationship is driven more by a country’s level of Freedom shaping its subsequent level of Prosperity than by the reverse. As part of our annual work on the indexes, we plan to conduct further analysis on the direction and magnitude of the relationship between freedom and prosperity, and we encourage others to do the same.
We also analyzed the countries with the biggest score changes in the Freedom Index between 2006 and 2021. If our hypothesis is correct, we should expect big shifts in Freedom to be associated with meaningful changes in Prosperity. Two countries stand out for big changes in Freedom over this period, and we found that their Prosperity levels changed in the same direction.
See how scores have changed over time
Bhutan had the biggest jump in Freedom of any country between 2006 and 2021, and also showed an increase in Prosperity. In 2008, Bhutan experienced a transition from an absolute monarchy to a constitutional monarchy, including the establishment of an elected legislature. Bhutan’s Freedom Index score reflects these changes, with a 74-percent increase in Legal Freedom and a whopping 166-percent increase in Political Freedom between 2006 and 2021. During that time period, Bhutan’s income score increased by 91 percent, and there was a 35-percent increase in its Environment score.
Venezuela, by contrast, is the country that lost the most Freedom and Prosperity between 2006 and 2021—a result with roots in Hugo Chávez’s increasing political repression and embrace of socialist and populist economic policies as he consolidated power and restricted freedoms. The country dropped more than 42 percent in its overall Freedom score. The fall in its Political Freedom score was most pronounced—a 68-percent drop. On the Prosperity Index, Venezuela’s score plummeted 24 percent from 2006 to 2021. The country was once among the wealthiest and most developed in Latin America, but now scores poorly on Health, Income, and Happiness. Between 2014 and 2020, Venezuela—home to the world’s largest oil reserves, and a rich and democratic country at the end of the twentieth century—lost two-thirds of its gross domestic product (GDP). That is comparable to the 60 percent decline in GDP that Syria experienced during its civil war. Bad authoritarian leaders can devastate a country economically as much as a civil war can.
II. How we measured freedom and prosperity
We began our intellectual endeavor by identifying the factors that we thought were most important for gauging a country’s freedom and prosperity, and then set out to find data on these variables. This led us to twenty-eight variables from fifteen different data sources (and more than five thousand individual data points) measuring either freedom or prosperity. For each index, we then averaged the indicators with equal weighting. The indexes range from zero to one hundred, with higher values indicating more freedom and prosperity.
Our definition of prosperity is expansive. Normally, a country’s prosperity is expressed simply as per-capita income, which is indeed one of the metrics incorporated into our study in the form of gross national income (GNI) per capita. But this is far too narrow a measure on its own.
Since a country’s greatest asset is its people, we also assess how healthy they are through the World Bank’s measure of life expectancy. Prosperity extends beyond material wellbeing and includes the ability to live in a clean and sustainable environment—evaluated through the measure of water quality, which, while an imperfect proxy, was the best indicator of environmental performance available for every country over the timeframe of our study.
Prosperity should also translate into happiness, something we can measure thanks to the United Nations World Happiness Report.
Assessing prosperity requires tracking the treatment of minorities too, since a prosperous society should provide equal opportunities to all its citizens regardless of their background and not marginalize or persecute minorities. In our Prosperity Index, we use acceptance of religious minorities as a proxy (if also imperfect) measure since it was the best available indicator for the countries and years in this study. If this metric is lagging in a given country, we reason, then the rights of other minority groups are likely restricted there too.
In short, our Prosperity Index attempts to account for several of the conditions of human flourishing necessary for a truly prosperous society.
Our conception of freedom is likewise uniquely broad. We recognize the importance of economic freedom (where the rights of all businesses and economic actors are fairly upheld) and political freedom (where the rights of all citizens are protected). But our index also reflects legal freedom. We believe that societies need rule of law in order to prosper economically and politically. Legal protections are essential for defending against attacks on economic and political freedoms by those who want to enjoy unfair advantages at the expense of others.
While many existing indexes measure economic, political, and legal freedoms separately, our Freedom Index combines them. Each of these three core freedoms reinforces the other. And it is these freedoms, we believe, that help ensure that citizens’ prosperity will endure—that it can outlast any leader and weather any storm.
III. A deeper dive into the rankings
The 174 countries in our Freedom Index are divided into four categories: Free, Mostly Free, Mostly Unfree, and Unfree. Nearly three-quarters of the forty-one Free countries in the index are in Europe. European societies, in fact, hold nine of the top ten positions in this category, starting with Finland. The other Nordic countries and the three Baltic countries—all small democracies—follow closely behind.
There are fewer Free countries in other regions. The only African countries that appear in the Free category are Cabo Verde and Mauritius. Canada and the United States in North America, and Barbados, Chile, Costa Rica, and Uruguay in Latin America and the Caribbean, rank as Free. In the Asia-Pacific region, Australia, Japan, New Zealand, South Korea, and Taiwan ascend to the Free category as well. The United States and Japan are the only Free countries with populations above one hundred million people.
While the United States ranks as Free and Prosperous, it does not place near the top of either category—performing better on the Prosperity Index than on the Freedom Index. The country’s score for Economic Freedom is relatively high. But its Legal Freedom ranking suffers from lower scores on the Civil Justice and Criminal Justice components of the measure, and it trails many other wealthy democracies on Political Freedom, ranking several rungs below countries such as Italy and South Korea.
The Mostly Free category contains more countries than any other category in the Freedom Index. Near the top of the Mostly Free category are several nations in Eastern Europe and the Caucasus (such as Bulgaria, Georgia, and Hungary) that have generally progressed toward greater freedom in the years since the fall of communism, as well as many small island nations. The category includes some of the world’s largest states—Brazil, India, Indonesia, Mexico, the Philippines—as well as smaller countries like Bhutan, Israel, Montenegro, and Singapore.
One disconcerting finding from our study: Nearly half of the world’s population lives in countries that rank as Mostly Unfree. This category includes many of the world’s most populous nations: Bangladesh, China, Ethiopia, Nigeria, Pakistan, Russia, and Turkey. Countries that are Mostly Unfree have serious deficiencies in core freedoms but may also have some redeeming qualities that prevent them from falling into the Unfree category.
The smallest number of countries fall in the Unfree category. These are places where citizens live under brutal authoritarian rule. Some also have very high levels of violence and instability. Syria has the unhappy distinction of being the most Unfree country in our ranking. Several countries that may be even more repressive, such as North Korea, are not included in the index due to a lack of data.
In developing our Prosperity Index, we’ve likewise divided countries into four categories: Prosperous, Mostly Prosperous, Mostly Unprosperous, and Unprosperous.
Most of the Prosperous countries are in Western Europe, with the Asia-Pacific region home to the second-largest group. Canada and the United States are the only Prosperous countries from the Americas, and Israel the only Prosperous country from the Middle East. Most of the Mostly Prosperous countries are in Europe and Latin America. Seventy-five percent of the world population lives in an Unprosperous or Mostly Unprosperous society, with the latter category comprising half of the countries in the ranking.
IV. The autocratic mirage
Scholars have long debated the direction of the relationship between freedom and prosperity. The insight that freedom promotes prosperity goes back at least to Adam Smith’s The Wealth of Nations, which argues that laws and institutions that protect the liberty of individuals to pursue their own interests result in greater prosperity for the larger society.
Others argue the relationship goes in the opposite direction. Barrington Moore, for example, maintained that a country cannot sustain democracy without a thriving middle class. People acquire property and material wealth first, and then demand a voice in government, including the freedoms to protect their wealth. This hypothesis goes all the way back to Aristotle, who posited that a large, prosperous middle class may mediate between rich and poor, creating the legal foundation upon which political freedom may function. A century ago, Max Weber extended this line of thought, proposing that the middle class defends its economic power by enshrining it in laws and institutions.
A third possibility is that there is a positive feedback loop—with, for example, freedom producing prosperity, which, in turn, produces more freedom.
While it will take much more work from the Freedom and Prosperity Center and other researchers to resolve this complex debate, we believe that our data and associated analysis provide evidence that freer countries tend to become more prosperous.
Our indexes and others like them aren’t the only guides to understanding the relationship between freedom and prosperity. History and current events also yield numerous natural experiments.
Consider, for example, the one that occurred at the end of the Cold War in Central and Eastern Europe. Before the fall of communism in these regions, countries there had similar levels of freedom and prosperity. Some countries, like Estonia, Latvia, Lithuania, and Romania, chose democracy and free markets. Others, such as Belarus and Russia, came to be ruled by autocratic regimes over the following years. What was the result of these choices on the trajectories of their subsequent economic development?
These six countries had divergent economic paths between 1995 (the first year for which all countries had comparable data) and 2020. As evident below, the countries that chose freedom are between seven and nine times wealthier today, while the countries that remained autocratic are only between three and five times richer.
Increase of GDP per capita in selected former communist countries (1995–2020)
| GDP per capita (current US$) | |||
| 1995 | 2020 | Multiplier | |
| Estonia | 3,134 | 23,027 | 7.3 |
| Latvia | 2,330 | 17,726 | 7.6 |
| Lithuania | 2,168 | 20,234 | 9.3 |
| Romania | 1,650 | 12,896 | 7.8 |
| Belarus | 1,323 | 6,424 | 4.9 |
| Russia | 2,666 | 10,127 | 3.8 |
The data from our Freedom and Prosperity Indexes show similar results, as can be seen in the table below. Russia (ranked eighty-eighth) and Belarus (ranked eighty-second) underperform in the Prosperity Index relative to their freer neighbors.
The data from our Freedom and Prosperity Indexes show similar results. Russia and Belarus underperform in the Prosperity Index relative to their freer neighbors.
Scores of selected former communist countries
| Freedom 2021 | Prosperity 2021 | |||
| Score | Rank | Score | Rank | |
| Estonia | 87.2 | 14 | 65.6 | 36 |
| Latvia | 81.7 | 25 | 62.6 | 42 |
| Lithuania | 81.8 | 24 | 63.9 | 39 |
| Romania | 76.3 | 36 | 59.8 | 51 |
| Belarus | 39.4 | 139 | 50.0 | 82 |
| Russia | 41.2 | 135 | 49.0 | 88 |
We can draw similar conclusions by focusing on the decades after World War II, when China, Germany, and Korea were divided. Some people lived in communist countries, while others lived in countries with free markets and with political regimes that either were democratic from the beginning (West Germany), evolved into a democracy (South Korea and Taiwan), or had a wide range of freedoms (Hong Kong). Did people living in freedom become more prosperous over time?
Take the case of Germany. According to Organisation for Economic Co-operation and Development (OECD) data, democratic West Germany’s gross domestic product (GDP) per capita in 1950 was only about 1.5 times larger than that of communist East Germany ($4,280 vs. $2,796). But, by the reunification of Germany in 1990, West Germany’s per-capita income had grown to be 3.6 times larger ($19,441 vs. $5,403) than that of East Germany.
The experience of North and South Korea offers one stark example of how neighboring countries with different levels of freedom but otherwise similar histories can experience divergent prosperity outcomes. Both countries were poor in 1950, when the Korean War erupted. While the two countries lacked political freedom from the end of the war until 1980, they selected very different paths regarding economic freedom. South Korea’s dictators chose capitalism and secure property rights, while North Korea’s leaders selected a state-planned communist economy. By 1980, South Korea’s per capita income ($1,589) was more than double that of North Korea ($768).
Starting in the 1980s, South Korea undertook a transition to democracy, while North Korea remained a dictatorship. The addition of political freedoms in South Korea resulted in an even larger divergence in the economic paths of these two nations. United Nations data for 2021 show GDP per capita of $31,947 for South Korea and $639 for North Korea. Today, people living in the free South Korea are fifty times wealthier than those living in the unfree North Korea.
As we see it, the success of initially limited freedoms in creating greater prosperity in South Korea fueled the drive to even more freedoms, which in turn brought even more prosperity, putting the country on the path to becoming the thriving democracy we know today. Examples like these yield an important insight: Incremental advances toward more freedom in certain aspects of society should be celebrated, even if a country still lags on freedom in other areas. Rarely in history has progress on legal, economic, and political freedom come at the same time.
How does this story go when examining Chinese people living under different political and economic systems? The People’s Republic of China (PRC) has been under the control of the Chinese Communist Party (CCP) since 1949. China has never had political freedom, although it started instituting liberalizing economic reforms in the 1980s under Deng. Until its takeover by the PRC in 2020, Hong Kong was either under British control or an autonomous PRC region, enjoyed some democratic freedoms, and ranked among the freest markets in the world. Taiwan was established as a dictatorship at the end of World War II but adopted free markets. It started transitioning to democracy after 1975. What were the results of these institutional choices?
The PRC, Taiwan, and Hong Kong were all poor in 1961, with GNI per capita of $76, $163, and $437, respectively. But by 2020 their different levels of freedom resulted in different levels of prosperity. Free Taiwan and Hong Kong were able to break out of the middle-income trap, a situation in which a developing country moves from the poor to the middle-income category but gets stuck below the high-income threshold, currently calculated as a national per-capita income of $12,695. Unfree China, at least to date, has not. In 2020, per-capita income in China, Taiwan, and Hong Kong was $10,055, $25,055, and $46,324, respectively. These differences are also clear in our indexes. We have chosen not to rank Hong Kong because it is now under the control of the PRC. But Taiwan ranks Free and Mostly Prosperous, while China ranks Mostly Unfree and Mostly Unprosperous.
And yet China enjoys a reputation as one of the world’s most lustrous economic stars. What should we make of this?
We understand why China’s authoritarian model can seem appealing: Autocracies occasionally produce impressive bursts of economic development—ones that may even last decades. But we believe that one key lesson from history is that this progress is not durable if it is not grounded in freedom. There is a stark contrast between the mirage-like gains in prosperity that autocratic governments often achieve and the kind of lasting prosperity that only freedom can bring.
In theory, both democratic and autocratic countries could put in place sound institutions to produce long-run economic growth. But, in practice, democracies are much more likely to do so. Dictators often establish rules that maximize their political control and benefit themselves and their supporters, to the detriment of broader segments of society and the strength of economic institutions. On the other hand, because democratic leaders are drawn from, and represent, broader cross sections of society, they tend to put in place institutions that benefit wider swaths of that society. Likewise, the authoritarian tendency to accumulate power makes leaders reluctant to allow free markets, which, when properly regulated, reflect the decisions of numerous economic agents and are a sounder path to economic development than the decisions of an autocrat or central bureaucracy.
Some might think that autocratic rulers can use their consolidated power to push through needed economic reforms. But while authoritarian leaders may sometimes make sound economic decisions, they often make catastrophically unsound ones. For example, the collectivization of agriculture led to mass famine in Joseph Stalin’s Soviet Union, in Mao Zedong’s China, and in Kim Il-Sung’s North Korea. More recently, and less dramatically, bad financial decisions by Turkey’s leaders led to high inflation and currency collapse, while in Kazakhstan the kleptocracy of former President Nursultan Nazarbayev and his family led to social unrest. And a lack of institutional safeguards means that there is little to check a ruler who does not serve the interests of the people.
China, we believe, is on the path to becoming another example of transitory prosperity. During Mao’s nearly three-decade rule, the country remained poor as the government held fast to communist economic and political doctrine. Then, in 1978, Deng introduced elements of free-market capitalism by, for instance, protecting private property and opening up China to trade and investment with the wider world. In the three decades that followed, 800 million Chinese people rose from poverty and the Chinese economy grew roughly 10 percent annually. China gained accession to the World Trade Organization and was able to fully participate in the global trading system. It became a magnet for international investment and the workshop of the world.
But over the last decade, Chinese President Xi Jinping has retreated from such reforms, prioritizing political control over economic growth. The government is taking on an ever greater role in business amid the country’s creeping decoupling from the global economy. Political freedoms are further constricting: Gone is the collective leadership model introduced by Deng, replaced by Xi’s dictatorship-for-life, and there is less room than ever for dissidents. This is not an environment conducive to innovation, entrepreneurship, and economic growth, all of which the country will need to break out of the middle-income trap. Increasingly, it will be left to Xi himself to make the key economic and political decisions for a country of 1.4 billion people.
A slowdown in Chinese growth is already underway, and we believe that this is not coincidental. The OECD has predicted that China’s GDP growth rate will shrink by nearly half to under 5 percent in 2022 and remain below that level in 2023. If it maintains its present course, China will likely become a far less desirable destination for foreign investment, which may only lead to further economic stagnation. The absence of strong institutional safeguards has been on display with the government’s recent crackdown on its technology sector. Crucially for the Chinese people, they have no way to challenge or change the country’s new direction given their lack of political freedom.
Today’s China has many other structural deficiencies, including high levels of pollution, massive corruption, a shrinking of the working-age population as a result of the failed one-child policy, excessively harsh yet ineffective COVID-fighting policies, and an international community that is becoming more fearful of economic dependence on China.
Our own data shows the fuller picture of how China’s prosperity is lagging that of other countries. China ranks 167th on our measure of acceptance of religious minorities, an unsurprising result given its genocide against the Muslim Uyghurs, brutal policies against Tibetans, and persecution of people of faith in general. It also ranks 85th on our happiness metric.
Comparative rankings in the components of the Prosperity Index
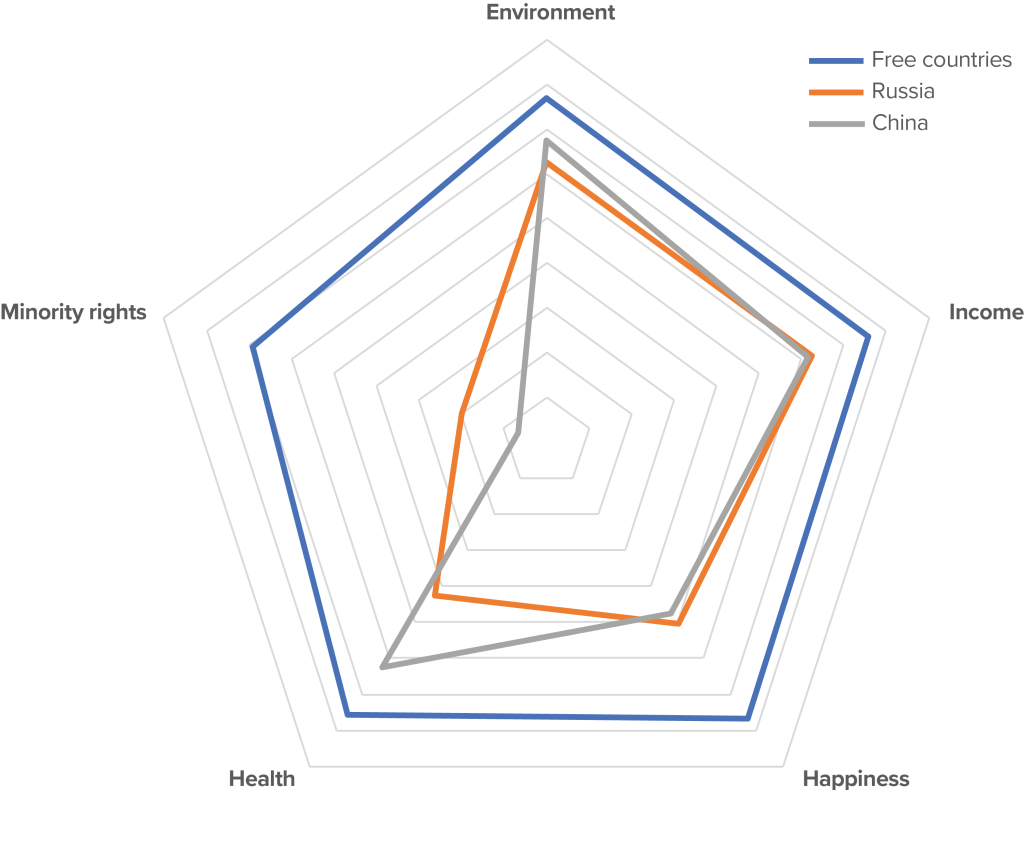
Note: We use the rankings of China and Russia and the average rankings of all countries included in the Free category. The five axes represent the five indicators forming the Prosperity Index. The center point represents a rank of one hundred and seventy-four, the worst possible performance. The outer line represents a rank of one, the best possible performance on each indicator.
There are, of course, some exceptions to note. Singapore, which is often cited as the leading example of how non-democracies can provide economic prosperity, is ranked Prosperous but only Mostly Free owing to its poor score on Political Freedom. We believe that the explanation for the country’s performance is simple: Singapore has been fortunate in that it has been exclusively governed by wise authoritarian leaders. The city-state has only had three prime ministers in its history, and all, so far, have prioritized economic and legal freedoms. Sooner or later, however, that luck could run out. Given that political power in the country is concentrated, future leaders could choose to rein in these freedoms. While it might be difficult to imagine them killing the goose that laid the golden egg, there are many examples of autocratic leaders doing just that when they feel that it is necessary to protect their political power. Allowing more political freedom in Singapore would provide guardrails against such changes to the country’s successful economic model. Moreover, a model that might work for a small city-state like Singapore does not easily apply to larger countries.
Another major exception to our finding that autocracies don’t tend to produce prosperity comes from the Gulf monarchies. Aside from the United Arab Emirates (UAE), all these countries fall into the Mostly Unfree category. But Bahrain, Kuwait, Oman, and Qatar all rank as Mostly Prosperous. Due to the large revenues they receive from oil extraction, these countries score particularly highly in one of the key indicators of prosperity, GNI per capita. (They nevertheless rank relatively poorly on other prosperity indicators such as the Environment and Minority Rights.) Yet while Gulf monarchies have earned record income from high oil prices over the preceding decades, the world may be moving away from fossil fuels and toward cleaner forms of energy. To succeed in such an environment, oil-producing states will need to liberalize their economies and allow their people more freedoms. These countries’ overreliance on resource extraction may also make them less competitive in other economic areas in the long run, since profits from natural resources disincentivize entrepreneurship and diversification into other industries.
The UAE outperforms all the other Gulf monarchies on our Freedom and Prosperity Indexes—ranking not just Mostly Prosperous but also Mostly Free. While its measures of political freedom are quite low, the country allows a wide range of economic and legal freedoms.
V. How to promote freedom and prosperity
Based on the data from our indexes and other scholarship and historical evidence, we believe economic, political, and legal freedoms are the surest path to sustainable prosperity. Those interested in increasing economic development and overall prosperity should prioritize the promotion of these three freedoms.
When engaging with developing countries, those of us in democracies in the developed world should be building the case for freedom by focusing not on our own values but on their self-interest. We hope the data in our indexes can help make that case more persuasive, while also providing guideposts for how governments can achieve greater freedoms through specific, tailored reforms. We also hope that leaders in developing countries will see in our indexes the prosperity they stand to gain from new measures to advance freedom. We’ll be here to measure progress along the way.
Such change must come organically from developing nations themselves, but there are also ways for states in the developed world to support it. The United States and other democracies should continue to encourage progress toward the three freedoms in their foreign relations with other countries. China and Russia want to fashion a world safe for autocracy, and their practices, including in foreign assistance, have contributed to a decline in global freedom. The United States and its democratic allies and partners should respond by developing a competitive free-world model of foreign aid and infrastructure investment.
The private sector in established democracies, meanwhile, can work through bilateral chambers of commerce to promote the three freedoms as the best way to attract foreign companies and direct investment. Those foreign companies, in turn, can be a force for good in developing countries; in addition to bringing new capital and technologies to these markets, they can offer jobs and training to local workers while also introducing international best practices.
International organizations, meanwhile, should endorse economic, political, and legal freedom as the most reliable path to prosperity. This won’t be easy for such organizations, as they may be under pressure from authoritarian member states that argue their models of government are just as valid. But these organizations can counter that pressure with the empirical evidence provided by studies such as this one. Philanthropic organizations can play a role too. Those dedicated to helping people in developing countries, and particularly the poor and marginalized, should consider funding initiatives that improve freedoms, which can in turn attract foreign investment and help developing nations create jobs and prosper.
Having found a significant correlation between core freedoms and prosperity in our first study, the Freedom and Prosperity Center will now aim to advance that work. We will extend our dataset back fifty years in an effort to better capture slow-moving changes in levels of freedom and prosperity. In partnership with the Acton Institute, we are offering academic grants to scholars who will collaborate with us to analyze the data. We are also identifying practical applications for our analytical endeavors. In partnership with the Atlas Network, we are making reform grants to think tanks in developing countries, with the first batch going to think tanks in Burundi, India, Mexico, and the Philippines that are preparing proposals for their national governments and legislatures regarding how to improve property titling, labor regulations, and business-formation regulations. Our Mexican think-tank partner plans to create freedom and prosperity indexes to evaluate the country’s thirty-two federal entities.
While we believe freedom is a worthy goal for its own sake, illuminating its practical benefits can only help in its promotion. We need to show what freedom can accomplish. And the numbers make our case.
This Big Story is adapted from the Freedom and Prosperity Center’s June 2022 report, “Do Countries Need Freedom to Achieve Prosperity?”
Dan Negrea is the senior director of the Atlantic Council’s Freedom and Prosperity Center. Between 2018 and 2021, he served at the US Department of State as the special representative for commercial and business affairs and as a member of the secretary of state’s Policy Planning Office, where he was responsible for the economic portfolio. Before that, he held leadership positions in Wall Street firms. A native of Romania, he has written extensively on international relations.
Matthew Kroenig is the acting director of the Atlantic Council’s Scowcroft Center for Strategy and Security and a tenured professor of government at Georgetown University. A 2019 study in Perspectives on Politics ranked him as one of the twenty-five most-cited political scientists of his generation. He is the author of several books, including co-author of The Handbook of National Legislatures: A Global Survey (Cambridge University Press, 2009). The book introduced the Parliamentary Powers Index, which measures the strength of the national legislature of every country in the world. He is also a co-collaborator on “Conceptualizing and Measuring Democracy: A New Approach” in Perspectives on Politics (June 2011), which introduced the Varieties of Democracy (V-Dem) dataset that has been widely adopted in other indexes. He previously served as a V-Dem project co-manager.