By the Freedom and Prosperity Center

The Freedom and Prosperity Center aims to increase the prosperity of the poor and marginalized in developing countries and to explore the nature of the relationship between freedom and prosperity in both developing and developed nations.
Freedom and Prosperity around the world
See how scores have changed over time
Explore the data
Executive Summary
The Atlantic Council’s Freedom and Prosperity Center aims to increase the prosperity of the poor and marginalized in developing countries—and to explore the nature
of the relationship between freedom and prosperity in both developing and developed nations.
To aid in this task, this report introduces the new Atlantic Council Freedom and Prosperity Indexes.
The Freedom Index measures economic, political, and legal freedoms for nearly every country in the world, using the latest available data when the index was constructed at the end of 2021. The Prosperity Index measures economic wellbeing and human flourishing for the same countries and time period. In addition, we collected historical data to allow us to track and analyze change over time. We constructed the same indexes going back in five-year increments for the years 2006, 2011, and 2016; 2006 is the earliest date for which data on our indicators are available.
To be sure, there are limits to any data-collection effort. The world changes quickly, and the data we collected at the end of 2021 may not still represent current realities in every case. Russia, for example, is less free today than when we collected the data, due to Vladimir Putin’s invasion of Ukraine and his related crackdowns at home. In addition, we needed to choose indicators that could be applied across all countries and over time, but these generalized measures may not always fit neatly with the unique circumstances in every country. Still, despite these limitations, we believe that these indexes provide new and valuable information on global freedom and prosperity.
Going forward, we plan to update the indexes annually. The methodology to produce the indexes is straightforward and transparent, and is described in detail in the appendix.
We have built on the work of several comparable country indexes. Many of these measure one aspect or another of freedom or prosperity. Some combine freedom and prosperity indicators and produce a single index. Our approach in designing the Atlantic Council Freedom and Prosperity Indexes was different in a few ways.
The indexes demonstrate that there is a strong relationship between freedom and prosperity. This report draws on the trajectory of the results over time, and other historical evidence, to argue that freedom tends to result in prosperity. In other words, freer countries tend to be more prosperous, and we have reason to believe that improvements in freedom will, over time, lead to greater and more durable prosperity.
The report also shows that autocracies generally do not deliver prosperity for their people. All countries rated Prosperous in our index (except for Singapore and Israel) also rank as Free. All countries in our Free category fall in either the Prosperous category or in the upper half of the Mostly Prosperous category. Both China and Russia rank lower in the Prosperity Index than Free countries do.
These findings lead us to recommend that governments, international organizations, private-sector companies, philanthropic organizations, and others concerned with prosperity promote economic, political, and legal freedoms.
The center will use the indexes and supporting data for its own research, and will also make them available for other researchers. All the research and resources used to produce the indexes and this report are publicly available. The Freedom and Prosperity datasets are accessible on the center’s website. The indexes will be updated annually, allowing thinkers and doers to track progress over time. Through our work and the work of others, we hope to make the world freer and more prosperous.
Summary and key takeaways
We hope that scholars and practitioners can use these data to conduct a wide range of analyses and to forge practical recommendations. In this section, we present some of our own preliminary analysis to explore the central question of this project: what is the relationship between freedom and prosperity? To be sure, this has been the subject of enormous scholarly debate, and we will not be able to resolve this question in a single report. Still, this analysis brings new data to bear on this question. The data and analysis in this report indicate that freedom and prosperity are correlated, and provide further support for the thesis that freedom contributes to prosperity.
Prosperity is highly correlated with freedom
A central finding of this report is that prosperity and freedom are highly correlated. The correlation coefficient between the indexes is 0.81. High values of Freedom are associated with high values of Prosperity, and low values of Freedom are associated with low values of Prosperity. The R2 statistic shows that 66 percent of the variation in prosperity around the world can be explained by freedom (Table 5).
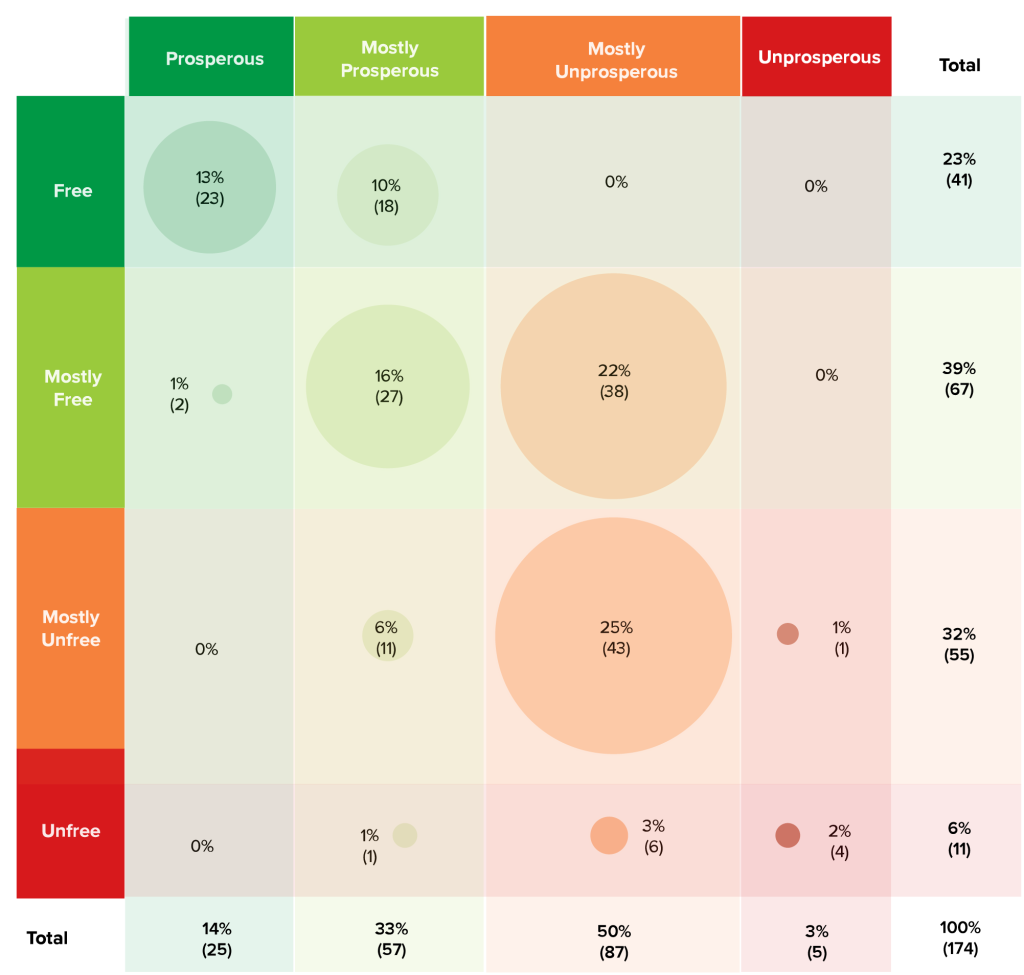
The strong relationship between freedom and prosperity can also be seen in simple descriptive statistics. With the exception of Israel and Singapore, every country in the Prosperous category is also in the Free category. Israel and Singapore (due to the latter’s high levels of economic freedom) occupy the two highest positions in the Mostly Free category (Table 4).
Moreover, no Free countries in 2021 are Mostly Unprosperous or Unprosperous; they are either Prosperous or Mostly Prosperous. The forty-one countries that comprise the top category of the Freedom Index also all rank in the top fifty for the Prosperity Index, except for Romania (fifty-one in the Prosperity Index) and Cabo Verde (eighty-one).
In addition, all Unfree countries in our Freedom Index rank in the Mostly Unprosperous or Unprosperous categories in our Prosperity Index—except for Cuba, which scores above fifty on Minority Rights and Health.
Continuing with the descriptive statistics, we find that citizens in Free countries are five times richer in per capita income ($36,142) than citizens in Mostly Free countries ($7,246) (Table 3). They are six times richer than citizens in Mostly Unfree societies ($5,791).
Table 3: Descriptive statistics across Freedom Index categories
| Category | Country counts | Freedom Index | Population covered | GNI per Capita (US$) | Health Score | ||||||||
| Mean | Median | Mean | Median | Mean | Median | Mean | Median | ||||||
| Global | 174 | 56.7 | 55.7 | 7,686 | 100% | 13,312 | 5,070 | 62.2 | 67.2 | ||||
| Free | 41 | 83.2 | 82.3 | 1,131 | 15% | 36.142 | 32,290 | 87.5 | 89.9 | ||||
| Mostly free | 67 | 60.8 | 59.7 | 2,824 | 37% | 7,246 | 7,246 | 60.6 | 65.9 | ||||
| Mostly unfree | 55 | 39.7 | 40.5 | 3,570 | 46% | 5,791 | 5,791 | 49.1 | 47.1 | ||||
| Unfree | 11 | 18.3 | 18.9 | 157 | 2% | 2,775 | 2,775 | 43.7 | 42 | ||||
Table 3 Continued: Simple statistics across Freedom Index categories
| Category | Country counts | Environment Score | Happiness Score | Minority Rights Score | Prosperity Index | ||||||||
| Mean | Median | Mean | Median | Mean | Median | Mean | Median | ||||||
| Global | 174 | 45.4 | 46.1 | 62.2 | 56.1 | 79.1 | 87.6 | 51.2 | 49 | ||||
| Free | 41 | 80.7 | 89.2 | 79.4 | 78.4 | 94.6 | 95.9 | 76.9 | 79.1 | ||||
| Mostly free | 67 | 38.7 | 41.6 | 52.1 | 52.4 | 85.3 | 88.9 | 48.2 | 47.7 | ||||
| Mostly unfree | 55 | 30.4 | 27.1 | 47.0 | 45.3 | 66.7 | 70.0 | 40.0 | 38.3 | ||||
| Unfree | 11 | 29.4 | 29.5 | 27.5 | 22.6 | 47.6 | 45.6 | 30.5 | 31.3 | ||||
The quality of life is also different in Free and Unfree societies. As can be seen in Table 3, Health, Environment, Happiness, and Minority Rights improve as a country moves toward greater freedom. The average Health score jumps from 60.6 to 87.5 when moving from the Mostly Free to the Free category. The average Environment score drops by more than 50 percent when moving from the Free group to the Mostly Free group. People in Free countries are almost three times happier than people in Unfree countries. For Minority Rights, the gap is smaller between the Mostly Free and Free groups (nine points), but the score drops significantly as freedom decreases, with gaps of almost twenty points between Mostly Free and Mostly Unfree, and again between Mostly Unfree and Unfree. These results suggest that more freedom is associated with a better life for the average person.
Table 4: Overlap between freedom and prosperity categories
Evidence suggests that freedom contributes to prosperity
In this section, we examine whether freer countries tend to become more prosperous over time. Scholars have long debated the direction of the relationship between freedom and prosperity. The insight that freedom promotes prosperity goes back at least to Adam Smith’s The Wealth of Nations, which argues that laws and institutions that protect the liberty of individuals to pursue their own interests result in greater prosperity for the larger society.
Others argue the relationship goes in the opposite direction. Barrington Moore, for example, argues that a country cannot sustain democracy without a thriving middle class. People acquire property and material wealth first, and then demand a voice in government, including the freedoms to protect their wealth. This hypothesis goes all the way back to Aristotle, who posited that a large, prosperous middle class may mediate between rich and poor, creating the legal foundation upon which political freedom may function. A century ago, Max Weber extended this line of thought, proposing that the middle class defends its economic power by enshrining it in laws and institutions.
A third possibility is that there is a positive feedback loop; freedom begets prosperity, which, in turn, begets more freedom.
The idea that institutions are the key to long-run economic growth is well established in contemporary economic theory. Institutions provide the rules of the game. Rules that incentivize entrepreneurship, hard work, long-term planning, and broad access to economic opportunities tend to produce wealthier societies. Rules that stifle innovation, discriminate against certain segments of society, and do not guarantee that individuals will be able to enjoy the fruits of their labors and creations tend to produce poorer societies.
In theory, both democratic and autocratic countries could put in place sound economic institutions to produce long-run growth. But, in practice, democracies are much more likely to do so. Dictators often establish rules that maximize their political control and benefit themselves and their supporters, to the detriment of broader segments of society. On the other hand, because democratic leaders are drawn from, and represent, broader cross sections of society, they tend to put in place institutions that benefit wider swaths of that society.
We will not be able to definitively resolve this complex debate in a single report, but we do bring new data to bear on these questions. We believe that our data and associated analysis provide evidence that freer countries tend to become more prosperous.
In an effort to disentangle this relationship, we examined the strength of the correlations between freedom and prosperity over time. Using the same methodology, we re-created the 2021 Freedom and Prosperity Indexes for 2016, 2011, and 2006. We examined whether measures for freedom in prior years are associated with levels of prosperity in subsequent years. After all, changes in prosperity do not happen overnight. If freedom drives subsequent prosperity, then we should see the correlations between freedom in prior years more strongly associated with levels of prosperity in subsequent years.
This is what we found. Indeed, as one can see in Table 5 and Figure 6, the longer the time lapses between our measures of Freedom and Prosperity, the stronger the association. A country’s level of Prosperity today is better explained by its level of Freedom in 2006 than by its current Freedom. In this analysis we are concerned with the general trend over time, not the absolute differences from year to year. The correlation and R2 statistics are higher the further one goes back in time, indicating a stronger fit between past Freedom and future Prosperity. The 2006 Freedom Index, the earliest measure of Freedom calculated for this report, is most strongly associated with levels of Prosperity in 2021. While the relative differences may seem small, they are in a consistent direction. This rough test does not provide definitive proof that advances in freedom produce subsequent prosperity, but it is suggestive of such a dynamic and worthy of further investigation.
Table 5: Historical correlations
| Prosperity 2021 | |||
| Freedom Index Year | R2 | Slope | Simple Correlation |
| 2021 | 0.656 | 0.762 | 0.810 |
| 2016 | 0.662 | 0.771 | 0.814 |
| 2011 | 0.673 | 0.809 | 0.821 |
| 2006 | 0.677 | 0.834 | 0.823 |
Note: The table is based on the results of simple ordinary least squares regression, in which Prosperity Index 2021 is the dependent variable and time series of the Freedom Index are the explanatory variables.
We also tested the alternative hypothesis. Are past levels of Prosperity more strongly associated with current levels of Freedom? While there is a relationship, it is weaker than the link between Freedom and subsequent Prosperity. For example, the R2 statistic between Prosperity in 2006 and Freedom in 2021 is 0.613, while the same statistic for Freedom in 2006 and Prosperity in 2021 is 0.677. Freedom in a given year is more strongly associated with subsequent prosperity than the reverse. This simple test suggests that the relationship is driven more by a country’s level of freedom shaping its subsequent level of prosperity than by the reverse.
As we plan to update the data annually, we look forward to conducting further analysis on the direction and magnitude of the relationship between freedom and prosperity, and we encourage others to do the same.
We also analyzed the countries with the biggest score changes in the Freedom Index between 2006 and 2021. If our hypothesis is correct, we should expect big shifts in the independent variable (Freedom) to be associated with meaningful changes in Prosperity.
Two countries stand out for big changes in freedom over this period, and we found that their prosperity levels changed in the same direction.
Bhutan had the biggest jump in Freedom of any country between 2006 and 2021, and also showed an increase in Prosperity. In 2008, Bhutan experienced a transition from an absolute monarchy to a constitutional monarchy, including the establishment of an elected legislature. Bhutan’s Freedom Index score reflects these changes, with a 74-percent increase in Legal Freedom and a whopping 166-percent increase in Political Freedom between 2006 and 2021. Bhutan’s income score increased by 91 percent, and there was a 35-percent increase in its Environment score.
Venezuela, by contrast, is the country that lost the most freedom and prosperity between 2006 and 2021—a result with roots in Hugo Chávez’s increasing political repression and embrace of socialist and populist economic policies as he consolidated power. The country dropped more than 42 percent in its overall Freedom score. The fall in its Political Freedom score was most pronounced—a 68-percent drop. On the Prosperity Index, Venezuela’s score plummeted 24 percent from 2006 to 2021. The country was once among the wealthiest and most developed in Latin America, but now scores poorly on Health, Income, and Happiness.
Divergent development paths for formerly communist countries in Eastern Europe
As our next test, we look to the divergent paths of countries’ political and economic transitions after the end of the Cold War. The fall of communism in Central and Eastern Europe in the 1989–1990 period can be viewed as a kind of natural experiment. Before the fall, these countries had similar levels of freedom and prosperity. Some countries, like Estonia, Latvia, Lithuania, and Romania, chose democracy and free markets. Others, such as Belarus and Russia, came to be ruled by autocratic regimes over the following years. What was the result of these choices on the trajectories of their subsequent economic development?
These six countries had divergent economic paths between 1995 (the first year for which all countries had comparable data) and 2020. As we can see in Table 6, the countries that chose freedom are between seven and nine times wealthier today, while the countries that remained autocratic are only between three and five times richer.
Table 6: Increase of GDP per capita in selected former communist countries (1995–2020)
| GDP per capita (current US$) | |||
| 1995 | 2020 | Multiplier | |
| Estonia | 3,134 | 23,027 | 7.3 |
| Latvia | 2,330 | 17,726 | 7.6 |
| Lithuania | 2,168 | 20,234 | 9.3 |
| Romania | 1,650 | 12,896 | 7.8 |
| Belarus | 1,323 | 6,424 | 4.9 |
| Russia | 2,666 | 10,127 | 3.8 |
The data from our Freedom and Prosperity Indexes show similar results, as can be seen in Table 7. Russia (ranked eighty-eighth) and Belarus (ranked eighty-second) underperform in the Prosperity Index relative to their freer neighbors.
Divergent development paths for people living under communist and democratic governments
Table 7: Scores of selected former communist countries
| Freedom 2021 | Prosperity 2021 | |||
| Score | Rank | Score | Rank | |
| Estonia | 87.2 | 14 | 65.6 | 36 |
| Latvia | 81.7 | 25 | 62.6 | 42 |
| Lithuania | 81.8 | 24 | 63.9 | 39 |
| Romania | 76.3 | 36 | 59.8 | 51 |
| Belarus | 39.4 | 139 | 50.0 | 82 |
| Russia | 41.2 | 135 | 49.0 | 88 |
We can draw similar conclusions by looking at World War II as the starting point for a new development period. For decades after World War II, China, Germany, and Korea were divided. Some people lived in communist countries, while others lived in countries with free markets and with political regimes that either were democratic from the beginning (West Germany), evolved into a democracy (South Korea and Taiwan), or had a wide range of freedoms (Hong Kong).
This provides us with another natural experiment. Did people living in freedom become more prosperous over time?
We begin with Germany. According to Organisation for Economic Co-operation and Development (OECD) data, democratic West Germany’s gross domestic product (GDP) per capita in 1950 was only about 1.5 times larger than that of communist East Germany ($4,280 vs. $2,796). But, by the reunification of Germany in 1990, West Germany’s per capita income had grown to be 3.6 times larger ($19,441 vs. $5,403) than that of East Germany.
Let us now turn our attention to the Korean Peninsula. North and South Korea were both exceptionally poor in 1950. While both countries lacked political freedom from the end of the Korean War until 1980, they selected very different paths regarding economic freedom. South Korea’s dictators chose capitalism and secure property rights, while North Korea’s leaders selected a state-planned communist economy. By 1980, South Korea’s per capita income ($1,589) was more than double that of North Korea ($768).
Starting in the 1980s, South Korea transformed itself into a democracy, while North Korea remains a dictatorship. The addition of political freedoms in South Korea resulted in an even larger divergence in the economic paths of these two nations. United Nations data for 2021 show GDP per capita of $31,947 for South Korea and $639 for North Korea. Today, people living in the free South Korea are fifty times wealthier than those living in the unfree North Korea.
North Korea is not ranked in our indexes because it does not provide sufficient data. South Korea ranks thirty-fifth and Free in our Freedom Index and twenty-fifth and Prosperous in our Prosperity Index.
How does this story look when examining Chinese people living under different political and economic systems? The People’s Republic of China (PRC) has been under the control of the Chinese Communist Party (CCP) since 1949. China has never had political freedom, although it started instituting liberalizing economic reforms in the 1980s under Deng Xiaoping. Until its takeover by the PRC in 2020, Hong Kong was either under British control or an autonomous PRC region, enjoyed some democratic freedoms, and ranked among the freest markets in the world. Taiwan was established as a dictatorship at the end of World War II, but adopted free markets. It started transitioning to democracy after 1975. What were the results of these institutional choices?
The PRC, Taiwan, and Hong Kong were all poor in 1961, with GNI per capita of $76, $163, and $437, respectively. But, their different levels of freedom resulted in different levels of prosperity by 2020. Free Taiwan and Hong Kong were able to break out of the middle-income trap, while unfree China, at least to date, has not. The middle-income trap, a measure created by the World Bank in 2006, refers to a situation in which a developing country moves from the poor to the middle-income category, but gets stuck below the high-income threshold—currently calculated by the World Bank as $12,695 GNI per capita. In 2020, per capita income in China, Taiwan, and Hong Kong was $10,055, $25,055, and $46,324, respectively. These differences are also clear in our indexes. Taiwan ranks Free and Mostly Prosperous, while China ranks Mostly Unfree and Mostly Unprosperous. We have chosen not to rank Hong Kong because it is now under the control of the PRC.
Autocracies are generally not prosperous
Some might think that an autocratic ruler can guarantee stability and push through needed economic reforms. They might point to Singapore as an example of a prosperous non-democracy. But, such examples are few and far between.
Authoritarian leaders like to centralize power, and dislike strong economic institutions that may check their power. While authoritarian leaders may sometimes make good economic decisions, they frequently make catastrophically bad ones. For example, the collectivization of agriculture led to mass famine in Joseph Stalin’s Soviet Union, in Mao Zedong’s China, and in Kim Il-Sung’s North Korea. More recently, and less dramatically, bad financial decisions by Turkey’s leaders led to high inflation and currency collapse, while in Kazakhstan the long-lasting kleptocracy of former President Nursultan Nazarbayev and his family led to social unrest. Even if a country has a wise authoritarian leader who makes consistently good decisions, like Lee Kuan Yew of Singapore, there is no guarantee that his successor will be equally wise. Moreover, a model that might work for a small city-state like Singapore does not easily apply to larger countries.
Autocracies are also subject to rapid and dramatic reversals along the path toward greater prosperity. Venezuela, for example, a country rich in natural resources and with a democratic tradition, adopted authoritarian and socialist policies in the early 2000s. As a result, Venezuela lost two-thirds of its GDP from 2014 to 2019. This is comparable to the 60-percent drop in GDP Syria experienced during its civil war. Bad authoritarian leaders curtailing freedoms can devastate a country as much as a civil war.
Unfree societies do not depend on rules and institutions but, rather, on authoritarian decisions. These decisions may, at times, redirect capital and people toward more productive outlets and have a positive impact in the short term. But, over the long term, if these decisions are not accompanied by greater freedoms, these autocrats are likely to undermine any progress they achieve.
Likewise, the authoritarian tendency to accumulate power makes leaders reluctant to allow free markets, which, when properly regulated, reflect the decisions of numerous economic agents and are a sounder path to economic development than the decisions of an autocrat or central bureaucracy.
Figure 7: Comparative rankings in the components of the Prosperity Index
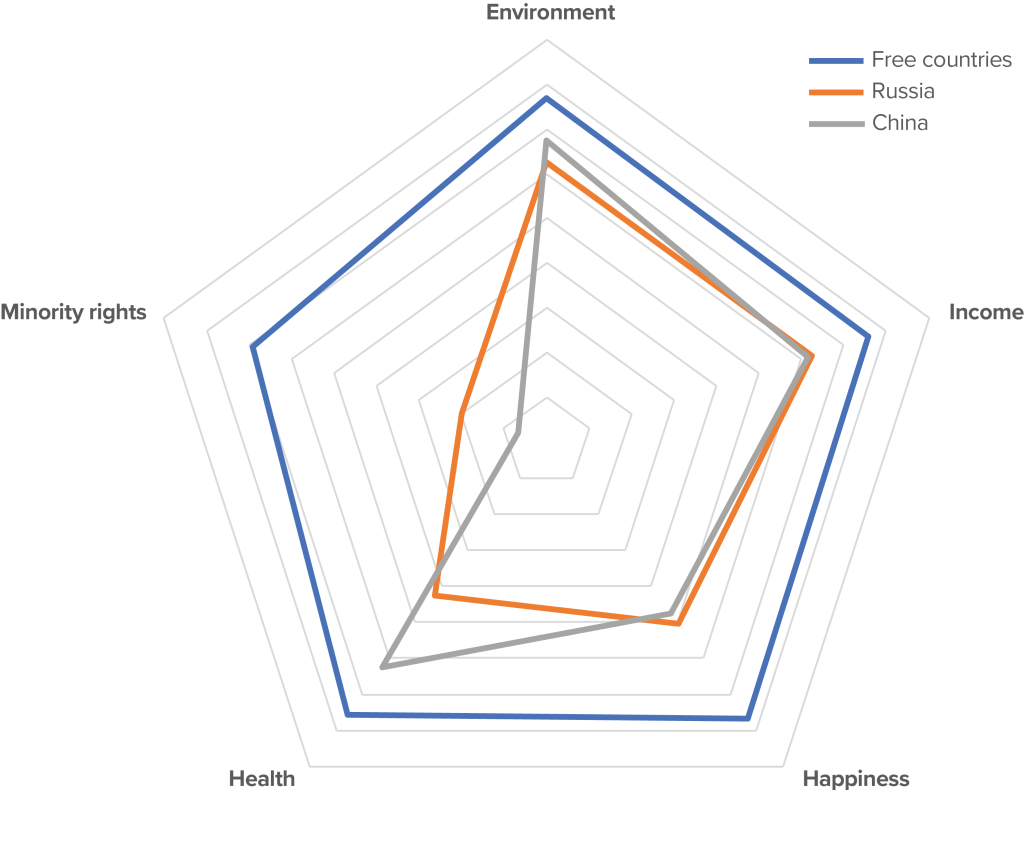
Note: We use the rankings of China and Russia and the average rankings of all countries included in the Free category. The five axes represent the five indicators forming the Prosperity Index. The center point represents a rank of one hundred and seventy-four, the worst possible performance. The outer line represents a rank of one, the best possible performance on each indicator.
China
China is often cited as a model of successful economic development, but our indexes do not bear this out. After seventy-three years of Communist Party leadership, China ranks one hundred and fortieth in the Freedom Index and one hundred and fourteenth in the Prosperity Index.
To be sure, China’s economic growth has been impressive in many ways, but it is still far from achieving broad-based prosperity. Looking at the components of the Prosperity Index, China ranks only fifty-seventh on the Income score, with a GNI per capita just over $10,000. This puts it squarely in the middle-income range, well below other Asian countries such as Japan, Taiwan, South Korea, and Singapore. While elites in China’s coastal cities are wealthy and there are far fewer Chinese living in poverty than in the past, the country’s interior remains largely poor.
China’s low position on the Prosperity Index is also explained by its Minority Rights rank of one hundred and sixty-seven out of one hundred and seventy-four (Figure 7). This score, part of our comprehensive view of prosperity, reflects China’s brutal policies in Tibet and genocide in Xinjiang.
There are also real questions about whether China’s state-led capitalist model can continue to deliver income growth. Xi Jinping prioritizes political control over economic growth, and has been backtracking on liberalizing reforms, as seen in his crackdowns on the Chinese tech sector. Moreover, China’s past path to growth was driven largely by exporting cheap manufactured goods and major infrastructure investments by the CCP.
To break out of the middle-income trap, however, China will need to become a true innovation leader and develop a consumer-based market. It is unclear whether it can make that transition without more freedom.
Furthermore, China has many other structural deficiencies, including high levels of pollution, massive corruption, a shrinking of the working-age population as a result of the failed one-child policy, excessively harsh yet ineffective COVID-fighting policies, and an international community that is becoming more fearful of economic dependence on China. The CCP announced in March 2022 that China’s GDP growth target for the year was “around 5.5 percent,” the lowest in thirty years. But, just a month later, the International Monetary Fund projected a 4.4 percent growth rate and some economists predict growth rates of under 4 percent. Even Xi Jinping has admitted that slow growth in China is “the new normal.”
Russia
Russia is a prototypical example of a Mostly Unfree and Mostly Unprosperous country. It ranks one hundred and thirty-fifth on the Freedom Index and eighty-eighth on the Prosperity Index. This is the result of more than seven decades of communism and two decades of authoritarianism after the fall of the Soviet Union in 1991 (with a brief period of experimentation with freer markets and political pluralism in the 1990s).
Russia enjoyed strong economic growth in the early years of the 2000s, thanks largely to high oil prices and more open markets. Russia, like China, is a middle-income country with a GNI per capita of approximately $10,000. Russia is similar to China on many metrics of Prosperity, with the exception of Minority Rights (one hundred and forty for Russia), where China ranks even worse. The data for our analysis were collected before Russia’s invasion of Ukraine. As Vladimir Putin clamps down on Russian society during the war, we expect Russia’s freedom and prosperity to decline further in the coming years.
Oil-extracting autocracies
The major exception to our finding that autocracies cannot produce prosperity comes from oil-rich states, like the Gulf monarchies. Oil revenues have allowed these autocracies to provide their citizens with some of the highest per capita incomes in the world.
Gulf monarchies
The Gulf monarchies, with the exception of the United Arab Emirates (UAE), all fall into the Mostly Unfree category.
Due to their ability to generate large revenues from oil extraction, however, these countries rank highly in one of the key prosperity indicators, GNI per capita. Their scores on our Prosperity Index, however, suffer because they rank poorly in other prosperity indicators like Environment and Minority Rights.
While Gulf monarchies have seen record income from high oil prices over the preceding decades, the world may be moving away from fossil fuels and toward cleaner forms of energy. To succeed in such an environment, oil-producing states will need to liberalize their economies and allow their people more freedoms.
Some Gulf monarchies are already taking limited steps in this direction. In Saudi Arabia, for example, the government has recently granted women greater rights and further opened to foreign investment.
United Arab Emirates
The UAE has been leading the way toward more freedom in the Gulf region. It outperforms all the other Gulf monarchies in both freedom and prosperity. While its Political Freedom measures are quite low, it does allow a wide range of Economic and Legal Freedoms. Indeed, taken together, these freedoms are sufficient to move the UAE into the Mostly Free category—the only country in the Gulf to receive this distinction. These greater freedoms have also resulted in superior economic performance. The UAE bests its neighbors to rank as the thirty-fourth most prosperous country globally in our index.
Singapore
Singapore is often mentioned as the leading example of how autocratic systems can provide economic prosperity. Our Freedom Index reveals, however, that the secret to Singapore’s success is quite straightforward. While Singapore ranks poorly on Political Freedom, it has among the highest levels of Economic and Legal Freedoms. Indeed, Singapore ranks as a Mostly Free country, and barely falls short of our threshold for fully Free.
Singapore demonstrates, therefore, that this model can work, but its example may be sui generis: Singapore is a small city-state. Indeed, there is much evidence that small countries open to international trade can prosper. But, it would not be easy to run a larger country in such a centralized manner.
In addition, Singapore has been governed, so far, by fairly wise autocrats who have continually prioritized economic and legal freedoms. Given that political power in the country is concentrated, however, there is always the risk that future leaders would choose to rein in these freedoms. While it may seem foolish to kill the goose that laid the golden egg, there are many examples of autocratic leaders doing just that if they feel that it is necessary to protect their political power. Allowing more political freedom in Singapore would provide guardrails against arbitrary changes to Singapore’s successful economic model, and better ensure its future prosperity.
Methodology and FAQ
FAQs
Frequently Asked Questions
1. What are the Atlantic Council Freedom and Prosperity Indexes?
The Freedom Index measures economic, political, and legal freedoms for nearly every country in the world. The Prosperity Index measures economic wellbeing and human flourishing for the same countries. The indexes can be used to inform policymakers about real-world reform opportunities in developing countries.
2. What time period does the report cover?
The 2021 Freedom and Prosperity Indexes use the most recent data available. Most of these data are from 2021. Where data from 2021 are not available, data from the most recent year available are used instead.
In addition, we collected historical data to construct the indexes for the years 2006, 2011, and 2016. This allows us to track national trajectories over time, even in the first year of the indexes. Going forward, we plan to update the indexes annually.
3. How are the data collected?
The Freedom Index and the Prosperity Index are constructed on a diversified data and analytical basis, comprising different databases produced by the American Economic Journal, the Center for Economic and Policy Research, the Credendo Group, the Fraser Institute, Freedom House, the Fund for Peace, the Heritage Foundation, NASA, Transparency International, the United Nations, the V-Dem Institute, the World Bank, and the World Justice Project.
4. What do the scores capture?
The Freedom Index and Prosperity Index are two separate indexes that rank 174 countries around the world according to their levels of freedom and prosperity. The Freedom Index measures Economic Freedom, Political Freedom, and Legal Freedoms. The Prosperity Index measures Income, Environment, Health, Minority Rights, and Happiness.
For more details on the construction of the indexes, please refer to the Methodology section.
5. How does the scoring system work?
All measurements in the indexes are weighted equally and the score for each index is the simple average of its parts. Scores range between zero and one-hundred, with higher values indicating more freedom or prosperity. Where appropriate, raw data are converted to a 0-100 scale.
6. What are the different scoring categories?
Countries on the Freedom Index are divided into four categories based on their overall score: those above a 75-point score (Free), those with scores between 50 and 74.9 (Mostly Free), those with scores between 25 and 49.9 (Mostly Unfree), and those with score from 0 to 24.9 (Unfree).
The same categorization is used for the Prosperity Index: those above a 75-point score (Prosperous), those with scores between 50 and 74.9 (Mostly Prosperous), those with score between 25 and 49.9 (Mostly Unprosperous), and those with scores from 0 to 24.9 (Unprosperous).
7. How is the ranking constructed?
We rank Freedom and Prosperity separately, and countries are ranked according to their score. Scores range between zero and one-hundred, with higher values indicating more freedom or prosperity.
8. Where can I view past years’ scores?
All the data are accessible on this website and can be downloaded.
9. Is there a link between Freedom and Prosperity?
We find that freedom and prosperity are highly correlated. The correlation coefficient between the indexes is 0.81. High values of Freedom are associated with high values of Prosperity, and low values of Freedom are associated with low values of Prosperity.
We find that the strength of this relationship increases the further one goes back in time. A country’s level of Prosperity today is better explained by its level of Freedom in 2006 than by its current Freedom, suggesting a relationship that is worthy of further investigation.
10. What makes the indexes different from other existing indexes?
There are several existing indexes that measure freedom and prosperity around the world, and our research built on these efforts. But the Atlantic Council Freedom and Prosperity Indexes are unique.
We define freedom comprehensively. Existing indexes measure economic freedom, political freedom, and legal freedoms separately, but no other index combines those measures to offer a comprehensive measure of freedom. It is our belief, supported by scholarship and historical evidence, that countries with all three types of freedom, working together in a manner that is mutually reinforcing, are best able to secure durable development.
We define prosperity comprehensively. We go beyond material measurements like income per capita and healthcare. We argue that a truly prosperous country should also score well on environmental performance, treatment of minorities, and the general happiness of the population.
We constructed separate indexes for freedom and prosperity. By creating two distinct indexes, we hope to give researchers a better opportunity to analyze the relationship between freedom and prosperity. We also offer policymakers and other thought leaders clearer benchmarks for implementing reforms and tracking results over time.
11. How do you prevent political bias?
The methodology used to produce the indexes is straightforward and transparent. We provide all the information to replicate them.
We did our best to collect the most reliable information available. The objective of these indexes is to provide standardized measures that can be applied to every country. One might argue that the methodology or the data collected is irrelevant to certain types of political situations or specific countries. That might be the case in some instances, but rarely so. Moreover, there is an inherent tension between generalizable and specific knowledge. We self-consciously opted for the former. We would encourage other researchers to explain how our indexes illuminate or obscure country-specific dynamics.
12. What are the limitations of the indexes?
Ensuring comparability of the data across a global set of countries was a central consideration. When selecting sources to be included in the indexes, coverage was the determining factor. In the rare case of missing data for a certain year, we have replaced the missing data with data from the closest available year. All these instances are described in the dataset.
Data were collected over the past year, using the most recent information available. They might not reflect the latest political or economic developments. These indexes should not necessarily be taken as an accurate reflection of the most recent current events. We will, however, update the indexes over time to capture real-world changes on an annual basis.
Authors


Technical Advisers