The purpose of the first-of-its kind G7-China Economic Radar is to provide an instrument that Group of Seven (G7) partners could use to evaluate their exposure to China and inform the cost/benefit analysis of sanctioning China in the event of a Taiwan crisis or other escalation.
Setting the scene:
- The G7’s primary economic and geopolitical challenger is China. Whether it is strategic competition or deterrence to protect Taiwan, the group’s toolkit needs to be evaluated and upgraded.
- An escalation in the Taiwan Strait would already put two trillion dollars of annual global economic activity at risk and severely cripple an island that is import-dependent for energy and food.
- The G7 countries have different vulnerabilities and dependencies with China, and coordinated action would be difficult, especially if the trade wars escalate.
Use our radar chart to explore G7 countries’ exposure to the Chinese economy, country by country. The more color on the radar, the more exposed that country and sector have been to the Chinese economy over the past several years.
Hover over each sector to see the exposure percentage. Reset the data visualization by clicking the arrow at the bottom of the chart.
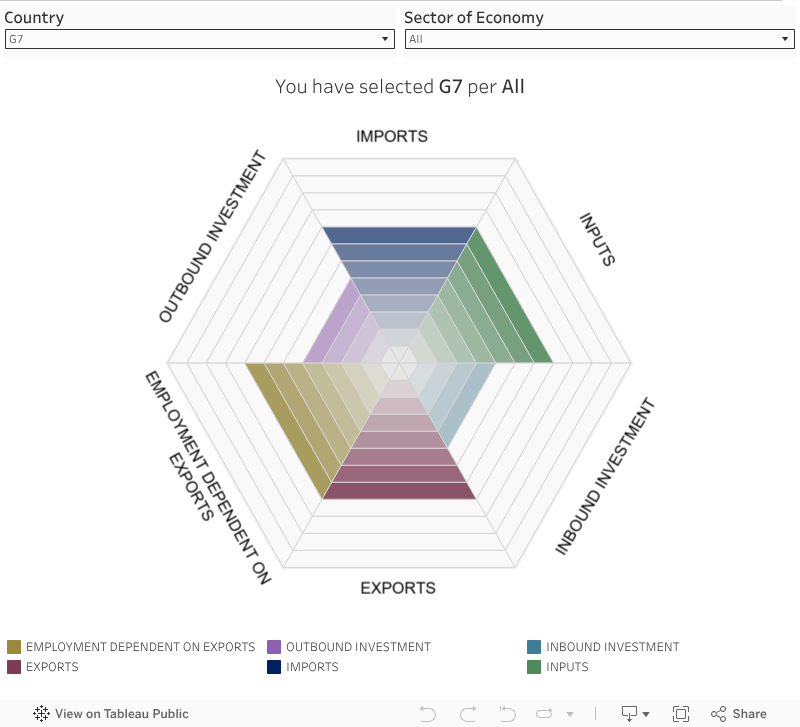
The radar shows exposure to China using a nonlinear scale, where a colored top bar means exposure is above 50 percent, the second-to-highest bar means above 40 percent, and so on with smaller intervals as exposure shrinks. Hovering over the sector will show exact percentage.
Our metrics and sources
Imports: The highlighted area shows imports from the People’s Republic of China as a share of total imports.
Source: TiVA Database (2023), ‘Gross Imports,’ OECD.
Share of exports: The highlighted area shows exports from the People’s Republic of China as a share of total exports.
Source: TiVA Database (2023), ‘Gross Exports,’ OECD.
Outbound Investment: The highlighted area shows the stock of foreign direct investment (FDI) in the People’s Republic of China as a share of total outbound FDI.
Sources: Direct Investment by Country and Industry, 2023, US Direct Investment Position Abroad on a Historical-Cost Basis, Country by Industry of Foreign Affiliate, BEA & Statista.
Inbound Investment: The highlighted area shows the stock of FDI from the People’s Republic of China as a share of total inbound FDI.
Sources: Direct Investment by Country and Industry, 2023, Foreign Direct Investment Position in the United States on a Historical-Cost Basis, BEA & Statista.
Inputs: The highlighted area shows manufacturing inputs imported from the People’s Republic of China as a share of total imported inputs.
Source: TiVA Database (2023), ‘Gross Imports of Intermediate Products,’ OECD.
Employment dependent on China: The highlighted area shows domestic jobs embodied in gross exports to the People’s Republic of China as a share of domestic jobs embodied in gross exports.
Source: TiM Database (2023), ‘Domestic employment embodied in gross exports,’ OECD.
Key takeaways
 Jobs at risk
Our employment vulnerability chart allows policymakers to look at real job numbers, while still being able to get a sense of each export-oriented sector’s proportion within a country, and between each country.
The green bars count the number of jobs in each sector that relied on Chinese demand in 2019. The red bars represent our modeled risk-weightings for each country and sector under a heavy sanctions scenario.
Select by country and hover over each bar to see the jobs at risk in the event of export bans. Reset the data visualization by clicking the arrow at the bottom of the chart.

Our methodology
Economic exposure radar:
For the first iteration of our G7-China Economic Radar, we have decided to focus on the year 2019. Much has since changed in the global economy. However, we needed to choose a year that was not characterized by the disruptions or distortions brought about by the COVID-19 pandemic, especially in 2020 and 2021. For the years since, data involving trade with the People’s Republic of China has become much less reliable and often simply unavailable on a sector-by-sector basis.
The radar is not intended to be the sole widget on the dashboard G7 principals see when they have to take on difficult decisions. However, it is an essential part of developing a nuanced picture of potential costs.
Should the G7 have to craft an immediate response that would be effective in deterring China, the bulk of coordinated measures would be directed at the Chinese economy directly. The radar evaluates each country’s strengths and weaknesses quickly and transparently.
Importantly, the radar maps bilateral economic relations almost comprehensively, but it does not show how Chinese firms and capital now pervade Western supply chains beyond Chinese territory. Surprisingly low exposure scores in some sectors—for instance mining—should always be seen as a trigger to dig deeper and check for transshipments. These make it even more challenging to build an effective economic statecraft strategy against China and may require measures that don’t only target the Chinese market.
Jobs at risk chart:
Drawing from the OECD’s Trade in Employment (TiM) database, we have simplified and removed overlap between sectors so that policymakers can quickly understand which parts of their economy rely the most on China. While the metric mainly focuses on how jobs are supported by Chinese demand, it is noteworthy that the TiM database’s methodology factors in reliances on Chinese inputs and investment. So the numbers already offer policymakers with a good guide to the number of jobs that will be vulnerable in the event of an escalation with China—with or without sanctions.
To further assist policymakers, we have modeled risk-weightings for each country and sector to estimate real job losses in a scenario where the G7 deploys sanctions, export controls, and other measures against China, and Beijing retaliates using similar measures (albeit against slightly different sectors).
Our weightings draw heavily from the first two reports in our Taiwan trilogy: “Sanctioning China in a Taiwan crisis: Scenarios and risks” and “Retaliation and resistance: China’s economic statecraft in a Taiwan crisis“. For instance, finance receives a high weighting in all the G7 because we believe similar financial sanctions to what are being used against Russia would be deployed again. Electronics and education also receive high weightings because we believe both sides would employ export controls and visa bans. On the other hand, repairs services—though they might be affected by the lack of inputs—would also receive a boost in demand as trade with China lessens. So the weighting for this sector is much lower.
Finally, it is important to remember that these numbers do not take into account the wider economic slowdown or the possible context of Taiwan being cut off from international trade. The same database suggests the number of G7 jobs dependent on trade with Taiwan alone was 855,300 in 2019. This is of course much smaller than the 3.4 million exposed to China, but the important point is that the G7 would already be grappling with the consequences of job losses before it decides to employ sanctions options against China.
 When would these tools be used?
Over the past decade, the G7 has increasingly added geopolitics to its original focus on economics. On the face of it, the shift has been driven by Russia, a former member of the group. G7 countries sanctioned the Russian economy in the aftermath of Russia’s first incursions into Ukraine in 2014. After Russia launched its full-scale invasion in February 2022, they agreed on the strongest package of coordinated sanctions ever developed.
Economic statecraft deployed in a coordinated manner by the G7 against Russia has delivered real results. However, these results have fallen short of stopping the full-scale invasion or forcing Russian President Vladimir Putin to any negotiating table.
Still, we assume that—in the event of escalation in the Strait of Taiwan or another form of Chinese aggression short of military invasion—the G7 and close partners will use economic measures, among others, to deter further aggression. As was the case with Russia’s full-scale invasion of Ukraine in 2022, the initial salvo of measures will have to be coordinated in advance. But, to obtain a better outcome than in 2022 and mitigate fallout to their own economies, the G7 must consider how best to employ economic statecraft tools in the event of a crisis with China that is below the level of invasion.
“Gray zone” scenarios include a quarantine, where China restricts shipping to Taiwan; punitive measures on cross-strait trade; or major attacks on telecommunication or energy connectivity.
In any of these scenarios, G7 partners will need to respond fast with measures that all sides are willing and able to apply. This will not be without its challenges.
First, according to research conducted by the Atlantic Council GeoEconomics Center and Rhodium Group, an escalation in the Taiwan Strait would already put two trillion dollars of annual global economic activity at risk. The island itself is dependent on imports for food and energy and, were shipping to Taiwan to be interrupted, the economic consequences would be felt around the globe as Taiwan produces 90 percent of the world’s most advanced semiconductors. In 2024 alone, Taiwan contributed at least 15 percent of semiconductor imports to G7 countries, amounting to over $26 billion.
Second, G7 members across the board have a very dense relationship with the economy of the People’s Republic of China. All will be exposed to pain in a way they were not in 2022, when energy supplies alone made the European Union much more reliant on Russia than anyone else. But the liabilities will still vary in their intensity from sector to sector and manifest in different ways.
G7 consumers buy products that aren’t made anywhere in the G7 but are supplied by China. Some sectors depend heavily on the supply of Chinese inputs, while others are buoyed by Chinese demand for their exports. Inbound and outbound investment ties to China also leave many sectors exposed. And finally, policymakers will always be attentive to how many jobs are dependent on trade with China to mediate domestic political pressures.
More country spotlights
What comes next?
These tools can help fuel policymakers’ critical conversations behind closed doors.
One of their most urgent priorities should be a coordinated approach to data as we have found substantial gaps especially when it comes to investment. More transparency among allies—at least on the ratios of their relative exposure to China—will make for better compromises that everyone can get behind.
It can also help check the robustness of widespread assumptions like the prevalence of Chinese critical minerals in our supply chains. A surprisingly low number should always trigger further investigations into transshipments and third-country manufacturing.
A Taiwan crisis could come at any time, and the G7 must prepare.
Acknowledgements
Research team: Charles Lichfield and Jessie Yin
Data collection by: Clara Falkenek and Charles Wheelock
Project editor: Josh Lipsky
Visual design: Mykhailo Tsyhanok
The feature is part of a yearlong series on economic statecraft across the G7 and China supported in part by a grant from MITRE.