By Ignacio Campomanes, Nina Dannaoui-Johnson, Annie (Yu-Lin) Lee, and Joseph Lemoine
Table of contents
- The dangerous authoritarian narrative
- What do the Freedom and Prosperity Indexes measure?
- The state of Freedom and Prosperity around the world
- Is political freedom needed for growth and prosperity?
- Is political freedom disconnected from economic growth?
- Factors masking the democracy-growth nexus
- A refined analysis of political freedom and economic growth
- Democracy favors economic growth
- Political freedom as a linchpin of prosperity
Stay Updated
Get the latest program developments, reports & research, and events.
The dangerous authoritarian narrative
A dangerous belief has taken root globally: that political freedom is not essential to prosperity and may even be an obstacle to economic growth.1While the early literature on the relationship between political freedom and economic performance pointed to a null or even negative association (see, for example: Barro, R. J., “Democracy and growth,” Journal of Economic Growth 1 (1996): 1–27; or Gerring, J., Bond, P., Barndt, W. T., and Moreno, C., “Democracy and economic growth: A historical perspective,” World Politics 57(3) (2005): 323–364), recent research, based on significantly better data and econometric methods, finds strong positive effects of democracy on growth in the long run (see, for example: Acemoglu, D., Naidu, S., Restrepo, P., and Robinson, J. A., “Democracy does cause growth,” Journal of Political Economy 127(1) (2019): 47–100; or Papaioannou, E. and Siourounis, G., Democratisation and growth. Economic Journal, 118(532) (2008): 1520–1551). This report demonstrates that this narrative is not supported by rigorous empirical evidence. On the contrary, the Indexes show that political freedom does lead to stronger long-term growth. In fact, the process of democratization alone provides an average 8.8 percent boost to gross domestic product (GDP) per capita after twenty years compared to its autocratic peers.
The deterioration of political freedom that began in 2012 remains an ongoing trend affecting countries across all regions and income levels. The continuing erosion of core political rights, such as freedom of expression and association, as well as the weakening of institutional checks on executive power, including judicial and legislative oversight, are alarming developments highlighted in this 2025 update of the Freedom and Prosperity Indexes.
The benefits of political liberalization take time to materialize. Policymakers must be persistent and patient before reaping the rewards of liberalization. And the same logic likely applies in reverse: Declines in political freedom may not have immediate economic consequences, but they carry long-term risks. Complacency in the face of democratic backsliding may ultimately jeopardize the prosperity of the next generation.
Although the Freedom and Prosperity Indexes currently capture this decline of freedom most clearly in the political dimension, the outlook for the rule of law and economic freedom is not much better. The erosion of democratic institutions and oversight mechanisms will likely contribute to declines in the rule of law and economic governance. Executives unchecked by legislatures or civil society are less likely to be held accountable for bureaucratic inefficiency or corruption, and more likely to pursue harmful economic policies.
The authoritarian narrative must be challenged with rigorous research and evidence-based analysis. History shows that it was free institutions—political, legal, and economic—that enabled today’s most developed countries to escape poverty and achieve remarkable prosperity over the past two hundred years. The Freedom and Prosperity Center remains committed to this mission, working alongside thousands of freedom advocates around the world to safeguard and advance the institutions that foster long-term prosperity.
What do the Freedom and Prosperity Indexes measure?
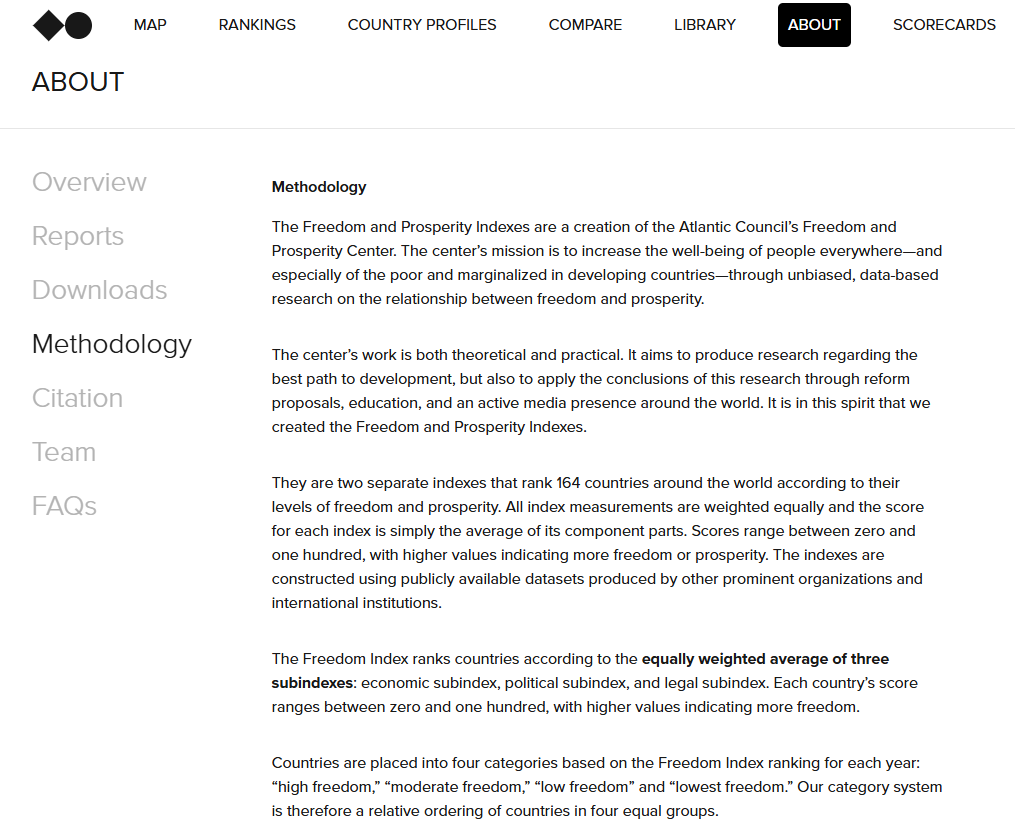
The Atlantic Council’s Freedom and Prosperity Center was created with the mission to increase the well-being of people everywhere—and especially of the poor and marginalized in developing countries—through unbiased, data-based research on the relationship between freedom and prosperity. The cornerstone of this project is the Freedom and Prosperity Indexes: a rigorous effort to assess the evolution of freedom and prosperity around the world, going back three decades.
The two indexes are based on well-established theoretical definitions of the concepts of freedom and prosperity, matched with respected empirical measures produced by international institutions, including the United Nations, the World Bank, the V-Dem project, or Fraser Institute.2For a detailed explanation of the theoretical framework and construction of the Indexes see the “Methodology” section of the Freedom and Prosperity Report 2023.
The Freedom Index
We think of freedom comprehensively, as a combination of a political dimension (democracy and individual rights), a legal dimension (the rule of law), and an economic dimension (free-market economy). Therefore, the Freedom Index aggregates three subindexes (political, legal, and economic), each covering several components.
The Freedom Index is composed of three equally weighted subindexes: political, legal, and economic
The political subindex measures the extent to which governments and lawmakers are responsive to the demands of citizens and respect their individual rights and liberties. The more democratic the political system, and the more it allows for citizens to oppose and contest those in power, the more public policies are expected to reflect the preferences of a majority of the population. The political subindex has four components: (1) elections; (2) political rights; (3) civil liberties; and (4) legislative constraints on the executive.
The legal subindex measures the degree to which a country abides by the rule of law—that is, whether citizens and government officials are bound by and abide by the regulations and laws of the land. It thus reflects certainty, stability, and predictability. The legal subindex includes five components: : (1) clarity of the law; (2) judicial independence and effectiveness; (3) bureaucracy quality and corruption; (4) security; and (5) informality.
The economic subindex is designed to measure whether most economic activity in a country is guided by the principles of free and competitive markets. An economically free society enhances the incentives to work and invest. Businesses and individuals can also capture the gains of an efficient allocation of resources guided by the price mechanism, and fully exploit the economic potential of its population. The economic subindex comprises four components: (1) property rights; (2) trade freedom; (3) investment freedom; and (4) women’s economic freedom.
We scale each component so that all have the same range (0–100), and compute each subindex as the unweighted average of its components. Finally, we arrive at a Freedom Index score for each country for each year, again using the unweighted average of the three subindexes.
In order to offer an intuitive and simple representation of the differences in freedom across countries, we assign one of four freedom categories (High Freedom, Moderate Freedom, Low Freedom, and Lowest Freedom) to each country-year observation. To do so, we use the Freedom Index rank for each year, labeling the level of freedom of the first quartile of countries as “High Freedom” (those that rank 1–41), “Moderate Freedom” for those in the second quartile (ranking 42–82), “Low Freedom” the third quartile (ranking 83–123), and “Lowest Freedom” those in the bottom quartile (ranking 124–164).
The Prosperity Index
The Prosperity Index also takes a broad view, going beyond the measurement of pure material well-being and including additional social aspects that we see as necessary for the discussion of a “prosperous society.” The Prosperity Index has six components: (1) income; (2) health; (3) education; (4) inequality; (5) minorities; and (6) environment. The first three components capture individual flourishing, while the last three assess whether prosperity is shared and sustainable.
Income per capita is the most widely used indicator of prosperity in economic and social science research. A prosperous society is necessarily one that has escaped generalized poverty and misery, and that generates sustained economic growth. The expectation of a long and healthy life and the opportunity to acquire knowledge are also widely considered to be standard dimensions of a holistic view of human flourishing.
A prosperous society requires that material well-being is shared among citizens and not concentrated in a small group. The components of inequality and minorities are intended to capture the degree of inclusiveness in a country. We measure inequality in terms of income, which is also highly correlated with education and health inequality. The minorities component captures the absence of discrimination regarding access to public services and opportunities, based on ethnic, social class, language, gender, political affiliation, and other considerations.
Finally, prosperity needs to be sustainable in the long run, and thus we include in the Prosperity Index a measure of environmental quality. This component is an equally weighted average of three sub-components, which deal with the wide variation in countries’ stage of development. First, we assess the cleanliness of a country’s production processes using the ratio of carbon dioxide emissions to GDP per capita (both in logs). Second, we capture the consequences of environmental quality for human life, using the rate of deaths from air pollution. Third, we consider the fact that in the least developed countries citizens can be exposed to unclean environments on a daily basis, so we use access to clean cooking technologies at a household level as a proxy.
As we do for the Freedom Index, we assign one of four prosperity categories (High Prosperity, Moderate Prosperity, Low Prosperity, and Lowest Prosperity) to each country-year observation. To do so, we use the Prosperity Index rank for each year, labeling as “High Prosperity” the first quartile of countries (those that rank 1–41), “Moderate Prosperity” those in the second quartile (ranking 42–82), “Low Prosperity” the third quartile (ranking 83–123), and “Lowest Prosperity” those in the bottom quartile (ranking 124–164).
The state of Freedom and Prosperity around the world
Global freedom continues to decline
The Freedom Map (linked below) illustrates the global landscape of freedom in 2024, as measured by our three subindexes (political, legal, and economic). Freedom remains unevenly distributed across the world, with scores ranging from a high of 93.8 in Denmark to a low of 16.9 in Afghanistan. The persistent low scores for some countries over several years (sometimes decades) highlight persistent gaps in institutional capacities and economic freedom, particularly in fragile and authoritarian states.
Explore Freedom and Prosperity world map
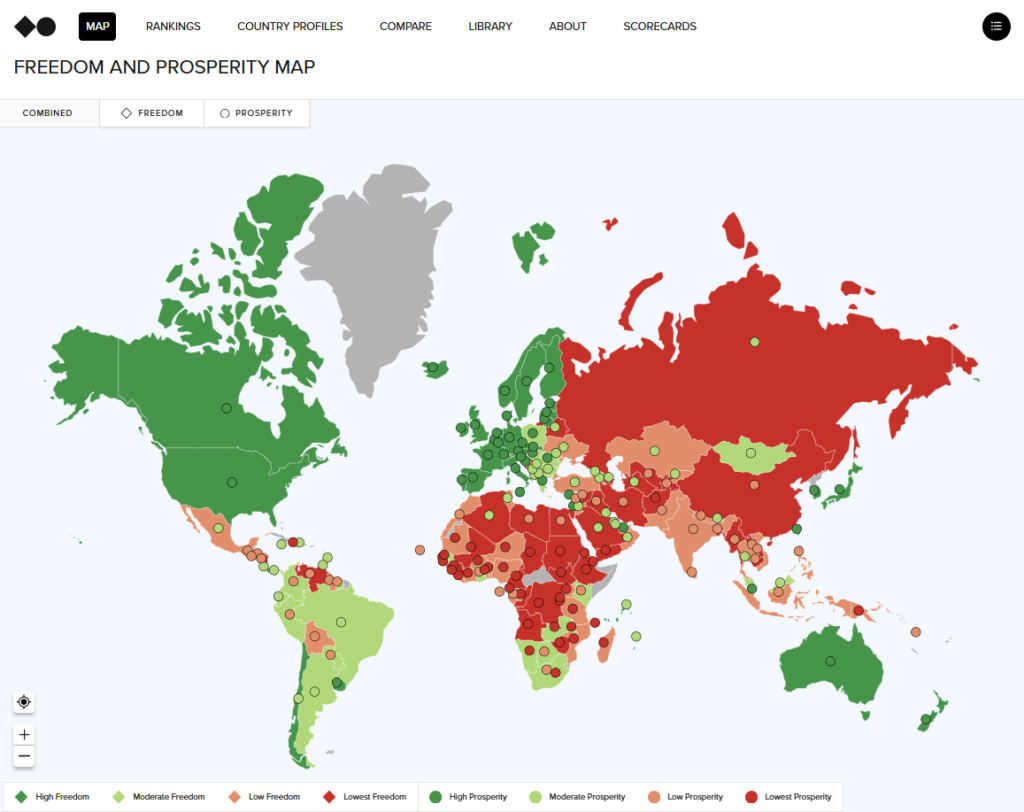
The Indexes rank 164 countries around the world. Use our site to explore thirty years of data, compare countries and regions, and examine the subindexes and indicators that comprise our Indexes.
Detailed Freedom Index scores and rankings for each country are available in Table 1. which also highlights changes in rank over the past year.
Because institutional reform is typically a slow and gradual process, the overall global distribution of freedom has remained quite stable over the past three decades. Western European countries continue to dominate the top of the Freedom Index, alongside Australia and New Zealand. Differences in scores among these countries are small, which helps explain seemingly large changes in rank, such as Finland dropping three positions or Germany falling five, even in the absence of major changes.
That said, it is noteworthy that both Canada (ranked 20th) and the United States (22nd) have lost ground relative to their European peers, falling four and three positions, respectively. Significant movements within the top quartile include Poland’s reversal of its recent democratic backsliding: It has gained eight positions in the 2025 Index and reentered the “High Freedom” category after eight years. In contrast, Slovakia’s performance is cause for concern, dropping eight positions following a nearly four-point decline in its Freedom score.
Among the middle two quartiles, categorized as “Moderate Freedom” and “Low Freedom,” we observe more dynamic shifts. On the positive side, the largest improvements were seen in Guatemala (up 26 positions), Vietnam (up 21), South Africa (up 13), and Jordan (up 12). The sharpest declines were recorded in Georgia (down 22 positions), Burkina Faso (down 17), and Mozambique (down 13).
Unfortunately, mobility within the “Lowest freedom” category remains limited. This group continues to include many countries from Sub-Saharan Africa and Central Asia. China (ranked 143rd) and Russia (145th), despite being two of the world’s most populous and geopolitically significant nations, remain firmly entrenched in the lowest tier, showing little progress toward greater freedom.
Table 1. Freedom Index scores and ranking for 2024
Looking beyond the most recent scores, the Freedom Index’s thirty-year coverage allows us to uncover some interesting dynamics. Figure 3 shows the evolution of the Freedom Index and its three subindexes since 1995 at a global level. The most striking—and worrying—trend is the negative evolution of the political subindex over the past twelve years. Democratic regression started in 2013, well before the COVID-19 crisis, accelerated during the pandemic, and continues today. The global average score of the political subindex in 2024 is similar to that of 1999, erasing 25 years of progress.
Figure 3. Political subindex is now at the same level as in 1999—a twenty-five-year low
The erosion of political freedom in the past decade is a generalized trend that affects countries at all levels of development, and across all regions of the world. Most notably, both the political subindex and the legal subindex have declined by more than two points globally.
Figure 4 shows that the OECD countries (those with the highest levels of income in the world, most of them well-established democracies) have experienced a decline in all three subindexes since 2014. For this group, the sharpest declines in the political subindex have occurred in Turkey, Mexico, Greece, and Hungary, each losing more than ten points over the past decade. In the legal subindex, which assesses the rule of law, Canada and the United States rank as the fourth- and sixth-largest decliners, respectively. Their scores dropped significantly due to a marked deterioration in the “clarity of the law” component, which evaluates whether legal norms are clear, transparent, stable, and consistently enforced.
Figure 4. OECD scores have declined across all three freedom subindexes in the past decade
Declines in the political subindex are significant across all regions, as shown in Figure 5. with South and Central Asia experiencing the largest fall (-6.12 points on average), followed by Middle East and North Africa (-5.27) and Sub-Saharan Africa (-5.16). Similarly, legal freedom has fallen in all regions except for South and Central Asia, but it is important to keep in mind that this region still shows the worst average score in this subindex.
Figure 5. The democratic decline has continued to worsen across all regions
The erosion of political freedom has been the most salient and generalized trend in recent times. We can examine what has been driving this by looking at the evolution of the political subindex components. Figure 6 presents the percentage change of each component since the political subindex peak in 2012. All three have decreased in the last twelve years, although with slightly different timing and strength. Changes in the components measuring elections, civil liberties, and legislative constraints on the executive are relatively minor until 2019, but worsen significantly during the pandemic (2019–2021) and continue to decline well after the world came back to relative normality.
The deterioration of the political rights component has been sustained and very strong since 2012, accumulating a loss of more than 10 percent. It seems clear that the restrictions imposed during the extraordinary circumstances of the COVID-19 crisis were only an accelerator of a process already incubated, as political regression started well before 2019, and continues up to this day.
Figure 6. All components of political freedom have declined since 2012
Until now, our analysis has focused on global and regional simple averages, where each country carries equal weight in the aggregate trends, regardless of its population size, geographic area, or GDP. Figure 7 examines how political freedom has evolved for the average individual worldwide. It compares the global development of the political subindex using a simple country average (blue) versus a population-weighted average (orange).
Figure 7. Population-weighted averages show lower political freedom scores and a sharper decline
Two related facts stand out. First, the level of political freedom experienced by the average citizen of the world is significantly lower than the country average would indicate. Second, its erosion over the past decade has been much steeper when we examine it through population-weighted averages. This is because countries with larger populations carry more weight in population-based averages, meaning their declines in political freedom impact the global trend far more than those in less-populous countries.
China is a big factor explaining the former, as it comprises more than 17 percent of the world population and has ranked among the bottom ten countries on the political subindex, and all its components, since 1995. India, the most populous country in the world, is the main driving factor of the latter, with a plummeting trend in political freedom since 2014 (-14 points). Significant declines in several other populous countries have also contributed to the steep downward trend, such as Russia (-14.5), Indonesia (-11.8), and Bangladesh (-9.8).
While the political and legal subindexes have declined since 2014, the economic subindex shows positive progress over the same period. In fact, two of its components, property rights protection and, most notably, women’s economic freedom, are the only areas of the entire Freedom Index to have improved globally since 2014 (see Figure 8). Women’s economic freedom, in particular, has risen by nearly seven points globally since 2014, and by almost twenty-three points since 1995.
Figure 8. Only women’s economic freedom presents significant improvement in the last decade
Virtually every country in the Index has experienced improvements in women’s participation in economic affairs in the past decade. It is encouraging to observe that some of the largest increases in this component have taken place in countries that had the lowest scores just ten years ago. The Gulf monarchies (especially the United Arab Emirates, Saudi Arabia, and Bahrain), together with some African countries such as Gabon and Democratic Republic of the Congo, present significant expansions in women’s rights. However, it is important to acknowledge that this measure is limited to economic rights only, and that further progress is needed if these countries are to catch up with the most advanced countries of Western Europe.
Explore Freedom and Prosperity world map

The Indexes rank 164 countries around the world. Use our site to explore thirty years of data, compare countries and regions, and examine the subindexes and indicators that comprise our Indexes.
Rising global prosperity, but worsening treatment of minorities
The Prosperity Map (linked below) shows the situation of prosperity around the= world according to the six prosperity components (income, health, inequality, environment, minorities, education) in 2024. Detailed scores and rankings for each country can be found in Table 2. The general distribution of prosperity is similar to that of freedom, with the Western world topping the top quartile (“High Prosperity”), and Africa being the least prosperous region.
Table 2. Prosperity Index scores and ranking for 2024
Large movements in the ranking position of specific countries in a single year are almost impossible as the components of prosperity vary only gradually and in the long term. Nonetheless, we do observe clear trends when looking at the evolution of prosperity and its components since 1995 (Figure 9). Most striking is the dramatic improvement of education globally, increasing by more than twenty points. The apparent stagnation in the last two years is the product of a lack of data from our preferred source (the UN’s Human Development Index). The disruptions caused by the COVID-19 pandemic are only lightly visible, but these do not seem to have obstructed the generalized positive trend toward increasing years of education across the globe, and especially in developing regions.
Other noticeable trends in the components of the Prosperity Index (Figure 9) include: A U-shape evolution of income inequality, which worsened from 1995 to 2005 but has improved since. Steady gains in health outcomes until 2019, followed by a sharp decline due to the COVID-19 pandemic and a partial recovery. Consistent improvement in environmental quality. And a visible decline in the treatment of minorities since 2019.
Overall, the big picture is clear: The world is becoming more prosperous. However, the specific driving forces of this process vary significantly between regions and levels of development.
Figure 9. Prosperity has improved across all components since 1995, but the treatment of minorities has worsened in the past decade
Figure 10 shows the 2024 score in the Prosperity Index for all seven regions of the world (the tip of each arrow), as well as the size and direction of change in each region’s score since 2014 (beginning of the arrow). The substantial differences in levels of prosperity between regions is by no means a novel finding, but it is always necessary to keep in mind these disparities when discussing how the different regions have evolved in recent years.
Figure 10. The Global South has been catching up in overall prosperity since 2014, but a significant gap remains (ten-year change on the Prosperity Index)
Sub-Saharan Africa and South and Central Asia are the most improved regions since 2014, with much of that performance attributable to substantial increases in the health, environment, and education scores. Nonetheless, it is also worth noticing that although decreases in the minorities component are generalized across the globe, the fall in South and Central Asia is the largest in the Global South. This trend may be attributable to the deterioration of political freedom in the region (see above).
Figure 11. The treatment of minorities has worsened across all regions in the past decade
North America is the only region in which overall prosperity has declined over the past decade, a trend that warrants several important caveats. First, as previously noted, North America still maintains a significant lead in overall prosperity compared to other regions, with the exception of Europe. This advantage holds across most components of the Prosperity Index. Second, the primary driver of the region’s decline is a drop in the minorities component of the Index. In both the United States and Canada (the region’s only two countries in our grouping, which places Mexico with Latin America and the Caribbean) this indicator has experienced a notable downturn in recent years. This decline is likely linked to more restrictive immigration policies, which may have reduced access to public services and economic opportunities for non-nationals and minority groups.
Is political freedom needed for growth and prosperity?
We now turn to a deeper question at the heart of the Freedom and Prosperity Center’s mission:
What is the relationship between freedom and prosperity?
In other words:
Is freedom the surest path to long-term development and well-being?
Prosperity and overall freedom are closely associated
In the 2024 Freedom and Prosperity Report, we presented substantial evidence of a strong and consistent association between freedom and prosperity. Figure 12 provides an updated visual summary of this link, showing a clear positive correlation (0.71) between the two Indexes across all countries in 2024: Nations with greater freedom tend to enjoy higher levels of prosperity.
Last year’s report further supported this finding by examining changes over time rather than one-off snapshots—an approach that helps control for potential econometric concerns. Even then, the positive relationship held: Countries that improved most in their freedom scores since 1995 also experienced the largest gains in prosperity. In addition, we explored the long-term impact of a significant increase in freedom (a freedom “shock”) and again found substantial positive effects on prosperity.
Figure 12. There is a strong positive correlation (0.71) between the Freedom Index and Prosperity Index
Is political freedom disconnected from economic growth?
Having established a strong positive relationship between overall freedom and prosperity, we now take a closer look at the connection between each of the three freedom subindexes—political, legal, and economic—and the various components of the Prosperity Index (Table 3). While each of the freedom subindexes is positively correlated with all prosperity components, the strength of these relationships varies.
One clear pattern emerges: The legal subindex, which reflects the quality of the rule of law, shows the strongest correlation with nearly all prosperity components (with the exception of inequality). By contrast, the political subindex is the one least strongly correlated with nearly all prosperity components (with the exception of minorities).
Table 3. The legal subindex (rule of law) correlates most strongly with prosperity (2024)
Some might argue that this strong relationship is driven mainly by the wealthiest countries, such as those in Western Europe, North America, Japan, Australia, and New Zealand, which tend to score high in both freedom and prosperity. To test this, we re-ran the analysis, excluding these high-income OECD countries and focusing only on the remaining 126 non-OECD countries. The strength of the correlations decreased, but the relationships remained positive in nearly all cases. The one exception was for the inequality component, where the correlation was essentially zero. This can likely be explained by the Kuznets curve, a well-known economic theory that suggests inequality tends to rise in the early stages of development before falling as countries grow richer. Since non-OECD countries span a wide range of development stages, it is unsurprising that inequality patterns are inconsistent among them, weakening the overall correlation.
One of the standout findings from the global data—that the legal subindex relates much more strongly than the political subindex to prosperity—is also repeated in this non-OECD-country analysis. For example, the correlation between political freedom and GDP per capita is just 0.17—three times lower than the correlation for the legal subindex.
Figure 13 illustrates this divergence by plotting 2024 scores in the legal and political subindexes against income per capita for non-OECD countries. On the left graph (political subindex), several countries—including Gulf monarchies, Belarus, Russia, and China—score low on political freedom but still enjoy relatively high income levels. Conversely, we also see a number of countries with strong political freedom scores (above 75) that perform poorly in terms of income, clustered in the bottom right of the graph.
Figure 13. At first glance, political freedom alone is not strongly related to growth
These findings raise challenging questions: Should we conclude that political freedom is not important for economic growth, and only marginally related to broader prosperity? Should the international community focus solely on strengthening the rule of law in developing countries as the most effective way to boost income? And if political rights don’t appear to drive growth, should we be less concerned about the global democratic backsliding seen in recent years?
These may appear to be logical observations based on the data—but a deeper dive into the Indexes, and the explanatory factors behind them, reveals that they are also simplistic, and misleading.
Factors masking the democracy-growth nexus
The simple correlations do not account for several important factors that may obscure the true relationship between political freedom and economic growth. First, democratization is often a disruptive process, generating fundamental changes to a country’s institutional framework through the expansion of key political rights and civil liberties. In the short term, such political transformations can generate uncertainty and require significant adjustment from economic actors as they adapt to new rules, norms, and power dynamics.
Moreover, democratization is frequently triggered by economic crises. While such crises may help mobilize civil society and create momentum for reform, they also place a heavy burden on newly democratic governments. Political scientists have described this as the “tumultuous youth” of democracy, that is, a phase marked by instability and delayed returns. As a result, the time horizon used to assess the impact of democratization is crucial: The economic effects of increased political freedom may only become visible in the medium to long term.
Take the case of Gambia, one of the countries that has made the largest gains in political freedom over the past decade, following a major democratization process beginning in 2017. It is too early to fully assess the economic benefits of these reforms, especially considering the significant external shock of the COVID-19 pandemic between 2019 and 2021.
Another limitation of simple cross-sectional correlations is that they overlook the starting conditions under which countries undertake political reform. Some countries begin democratization with strong legal and economic institutions already in place, while others do not. The Freedom Index is particularly useful here, as it disentangles—and independently measures—the political, legal, and economic dimensions of freedom. For example, a country can achieve high performance on rule of law without being democratic, just as it is possible to have a vibrant democracy with weak rule of law. This raises an important question: To what extent do the rule of law and economic freedom shape the relationship between political liberalization and economic growth? Focusing on the relationship between political freedom and the rule of law, we can imagine two possible scenarios, depending on whether they function as substitutes or complements:
- If substitutes: Political freedom could be especially beneficial in countries with weak rule of law, meaning improvements in either dimension could spark economic growth independently.
- If complements: The benefits of democratization may depend on having a strong legal foundation already in place. In this case, only countries that democratize after establishing robust legal institutions would see significant economic gains, while those lacking such foundations may not.
Finally, when evaluating the effects of political freedom, it is critical to define the right comparison groups. The “treatment group” should consist of countries that have undergone substantial and lasting increases in political freedom—not those with marginal or temporary changes. At the same time, the “control group” must be carefully chosen to serve as a credible benchmark—countries that have remained politically unchanged but are similar to the “treatment” country in other relevant characteristics.
The next subsection outlines a more rigorous analysis of the political freedom-economic performance relationship, taking these methodological challenges into account.
A refined analysis of political freedom and economic growth
To better understand the relationship between political freedom and economic growth, we revert to our analysis of 126 non-OECD countries, now over the period 1995–2019. We intentionally end the period before the COVID-19 pandemic to avoid distortions caused by its unprecedented economic disruptions.
Since the political subindex is a continuous measure, we set a threshold score of fifty. Every country-year observation of fifty or above is classified as “democratic”, and any score below is “autocratic.” Acknowledging that this threshold is somewhat arbitrary, we also tested alternative cutoffs—forty-five, sixty, and the sample median (65.9)—to assess the robustness of our results. Varying the cutoff does not significantly affect the results. Based on the 50-point threshold, we are able to categorize countries into four distinct groups, based on their political trajectories over time:
- Always Autocracies: Countries that remained below the fifty-point threshold throughout the entire period. This group includes twenty-five countries, such as China (Figure 14).
- Democratizers: Countries that started below the threshold in 1995 but crossed above it by 2019, indicating a sustained shift toward democracy. This group includes twenty-one countries, such as Nigeria.
- Autocratizers: Countries that started above the threshold in 1995 but fell below it by 2019, indicating democratic backsliding. There are nine countries in this group, such as Venezuela.
- Always Democracies: Countries that remained above the threshold throughout the entire period. This is the largest group, with seventy-one countries, such as Botswana.
Figure 14. An “Always Autocracy”, a “Democratizer”, an “Autocratizer”, and an “Always Democracy.” Political subindex scores (1995–2019) for one exemplar country from each of the four types, grouped by political freedom trends
We then compare the group of Democratizers against the group of “Always Autocracies,” as this creates the clearest counterfactual: What happens when a country democratizes versus when it remains authoritarian? This comparison involves a total of forty-six countries: twenty-one “Democratizers” and twenty-five “Always Autocracies.”
To examine the long-term impact of democratization on economic performance, we use local linear projections as our main analytical tool. This method is well suited to address the concerns discussed in the previous subsection, especially regarding timing and variation across countries. In simple terms, the technique involves running a series of regressions that estimate how a democratization “shock” (i.e., a significant increase in political freedom) affects real GDP per capita over time. We project these effects for up to twenty years into the future, plotting the estimated impact for each year.
For each “Democratizer” country, we identify the year of democratization as the one with the largest single-year increase in the political subindex, for example, 1999 in the case of Nigeria. Local linear projections also allow for the inclusion of important control variables. Specifically, we include: (1) country fixed effects to account for time-invariant characteristics (such as geography or historical institutions) that might influence growth regardless of political regime; and (2) year fixed effects to control for global shocks or trends that could affect all countries in a given year (such as financial crises or commodity price shifts).
These controls help isolate the true effect of democratization from broader national or global events that could otherwise bias the analysis.
Democracy favors economic growth
Figure 15 shows the cumulative effect of democratization on GDP per capita over a twenty-year period, comparing countries that experienced a democratization shock or episode with those that remained autocratic. The results are clear: Democratization has a positive and substantial long-term impact on economic growth. On average, countries that democratize achieve GDP per capita levels 8.8 percent higher than their autocratic counterparts after two decades.
Figure 15 also supports our earlier insight about timing: The economic benefits of political liberalization do not appear immediately. On average, it takes around six to eight years for the growth dividends of democracy to become visible—and around ten to twelve years for those benefits to be fully realized.
Figure 15. Democratization generates a boost in GDP per capita of 8.8 percent (compared with countries that remained autocratic)
To explore the interaction between political freedom and the rule of law, we divided the democratization episodes into two categories:
- High legal subindex score at time of democratization (above the median score)
- Low legal subindex score at time of democratization (below the median)
We find that democratization leads to long-term economic gains in both groups, but the effect is more pronounced in countries with weaker legal institutions at the time of democratization. In those cases, GDP per capita had grown 12.3 percent after twenty years, measured against their autocratic counterparts. In contrast, for countries that democratized under relatively strong rule of law conditions, the gain was more modest, at 5.3 percent over the same period.
These findings suggest a degree of substitutability between political and legal freedom: Where the rule of law is weak, political liberalization plays a more critical role in unlocking growth potential.
Political freedom as a linchpin of prosperity
This thirtieth year of the Freedom and Prosperity Indexes presents a complex picture. Encouragingly, our Prosperity Index shows broad growth, though significant regional disparities and challenges persist. Conversely, political freedom and the rule of law are in decline across the board. Whether in OECD or non-OECD countries, or across regions, all are experiencing a downturn. Our political subindex, which measures the extent to which a nation upholds civil liberties, democratic legislature, and the political rights of its constituents, reveals the increasingly dire state of global democracy—sinking to its lowest point in twenty-five years.
While prosperity encompasses far more than just income, sustained economic growth remains a critical pillar of long-term well-being. Our analysis provides compelling evidence that democratization contributes meaningfully to long-term economic growth, even if its effects take time to materialize. Over twenty years, countries that democratize achieve per capita GDP that is 8.8 percent higher than their autocratic peers. While the rule of law emerges as a consistently strong predictor of prosperity, our analysis also shows that political freedom plays a vital and independent role, particularly in contexts where legal institutions are weak.
Political liberalization can act as a powerful catalyst for progress, especially when it helps correct institutional deficits. At the same time, the impact of democracy on growth is not automatic or immediate; it depends on timing, national conditions, and the broader institutional environment. This underscores a central insight of the Freedom and Prosperity Indexes: that freedom, when exercised in its full political, legal, and economic dimensions—is not just a moral imperative, but a pragmatic path to shared prosperity.
Read the Freedom and Prosperity Indexes methodology
The Indexes rank 164 countries around the world. Use our site to explore thirty years of data, compare countries and regions, and examine the subindexes and indicators that comprise our Indexes.
Authors


Acknowledgements
We would like to thank Will Mortenson and Christine Hutchinson for their valuable contributions, and the team at Soapbox for their support with data visualization.
The Freedom and Prosperity Indexes are a creation of the Atlantic Council’s Freedom and Prosperity Center. The center’s mission is to increase the well-being of people everywhere—and especially of the poor and marginalized in developing countries—through unbiased, data-based research on the relationship between freedom and prosperity.
Related content


Explore the program

The Freedom and Prosperity Center aims to increase the prosperity of the poor and marginalized in developing countries and to explore the nature of the relationship between freedom and prosperity in both developing and developed nations.