
By Ignacio Campomanes, Nina Dannaoui-Johnson, Tomás Gómez Revelo, Annie (Yu-Lin) Lee, and James Mazzarella
Bottom lines up front
- Across countries and over time, aggregate freedom is strongly associated with higher prosperity.
- A strong rule of law is a prerequisite for broad-based prosperity—and is often a last barrier against democratic erosion.
- Globally, adherence to the rule of law has declined significantly since 2020.
Table of contents
- Introduction: Freedom erosion spreads beyond politics
- Results of the 2026 Freedom and Prosperity Indexes
- Key finding: The rule of law as a foundational pillar of prosperity
- Conclusion: Rebuilding the foundations of prosperity
Freedom erosion spreads beyond politics
The global environment has become more uncertain and, as such, more dangerous in many ways. The war in Ukraine has brought large-scale conflict back to Europe and forced governments to rethink security, energy, and industrial policy. The war in the Middle East has added another source of instability to global markets and international diplomacy. At the same time, great-power competition between the United States and China and other factors are reshaping trade and investment decisions, with tariffs, industrial policy, and supply-chain restrictions becoming more common. These developments are not external to the story of freedom and prosperity. They are precisely the kind of pressures that test the strength of institutions.
The data in the 2026 Freedom and Prosperity Indexes—which measure levels of political freedom, economic freedom and adherence to rule of law in one Index and levels of wealth and human development in the other–illustrate this pressure. At first glance, the aggregate Freedom Index remains relatively stable, but the deeper picture is more fragile. The data show political freedom, measured under the Political Subindex, continues to decline across much of the world and while economic freedom, measured under the Economic Subindex, remains higher now than in the 1990s, its recent progress is weaker than the headline index suggests. This is especially clear when you separate the women’s economic freedom component from the rest of the Economic Subindex. We can see that core economic freedom such as property rights protection, trade and investment freedom has been largely flat in recent years, which is consistent when open markets are no longer advancing with the same force as before. Economic freedom has long helped offset political decline in the aggregate Freedom Index; but if core economic freedom stalls, the overall freedom picture becomes more fragile.
While these downward trends in both political freedom and economic freedom are concerning, the most important warning sign in this year’s report is the decline in the adherence to the rule of law, measured under the Legal Subindex. For many years, the deterioration of freedom appeared mainly as a political phenomenon. That is no longer the case. The rule of law is often the last barrier against political backsliding–generally seen as weaker control and constraint of executive power by the legislative and weaker protection of political and civil rights, especially freedom of expression. In addition to declining political freedom and stagnating economic freedom, we can now clearly see the rule of law weakening in both advanced economies and developing countries, although from very different starting points. In advanced economies, this is especially worrying because the legal pillar has often acted as a barrier against political backsliding even when politics became more polarized, independent courts, predictable rules, and administrative checks helped contain the damage. If those legal foundations also weaken, political deterioration becomes harder to restrain.
The challenge is different, but no less serious, in developing countries. Countries that are not members of the Organisation for Economic Co-operation and Development (OECD) start from much lower levels of performance on their respective rule of law score. For them, stagnation or reversal in the rule of law, measured under the Legal Subindex is not only an institutional concern, it becomes a development constraint if left unaddressed. Weak legal institutions seriously hinder the ability of citizens and firms to plan, invest, and enforce rights. They also make it harder for governments to implement policies effectively. In countries where security—understood as the state’s ability to maintain public order and protect people from political violence, conflict, and everyday safety—is fragile, the problem is even more basic: Economic and political reforms have limited effects when violence or everyday insecurity dominate public life.
Simply put, legal institutions operate both as a prerequisite and as an enabler of prosperity. They are a prerequisite because high prosperity is rare where the rule of law, and especially security, is weak. They are an enabler because economic freedom produces larger prosperity gains when legal institutions are strong enough to support it. The rule of law does not replace political or economic freedom. It determines whether those freedoms work in practice.
In today’s geopolitical environment, therefore, the rule of law is not a technical detail. It is one of the foundational conditions that allows societies to remain free, attract investment, and turn growth into broad-based prosperity.
The policy implications are clear. Reforms aimed at opening markets, attracting investment, or expanding rights will remain fragile if courts are ineffective, rules are unpredictable, or public administration is captured by corruption. Economic reforms should therefore be accompanied by investments in legal capacity and public-sector integrity.
Legal institutions operate both as a prerequisite and as an enabler of prosperity.
Countries with weak legal institutions, usually found in non-OECD economies, should treat rule-of-law reform as a development priority, not as a secondary governance agenda. For OECD economies, the lesson is also clear: legal institutions cannot be taken for granted. Once the rule of law begins to erode, the costs of political polarization and institutional conflict become much higher.
Reforms that open markets, attract investment, expand political rights, or improve public services depend on legal institutions that can make those reforms effective in practice. Where courts are unreliable, rules are unstable, security is fragile, or public administration is captured by corruption, reforms in other areas remain vulnerable.
This warning applies to both OECD and Non-OECD economies alike, but in different ways. OECD economies have long benefited from strong legal foundations. Those foundations helped make political rights credible and market institutions reliable, which translated into broad and durable prosperity. A decline in the rule of law therefore puts at risk one of the institutional advantages on which their prosperity was built. In non-OECD economies, weak legal institutions are the main restraint on future development and, therefore, rule of law reform should be treated as a development priority, not as a secondary governance agenda.
Critically, the erosion of legal institutions is often gradual and difficult to observe. Its effects do not always appear immediately in growth rates, investment flows, or social outcomes. But once courts lose credibility, rules become unpredictable, or public administration becomes politicized, the damage can become costly to reverse. The warning signs visible in this year’s Legal Subindex should therefore be taken seriously now, before institutional weakening becomes harder to contain.
What do the Freedom and Prosperity Indexes measure?
The Atlantic Council’s Freedom and Prosperity Center was created with the mission to increase the well-being of people everywhere—and especially of the poor and marginalized in developing countries—through unbiased, data-based research on the relationship between freedom and prosperity. The cornerstone of this project is the Freedom and Prosperity Indexes: a rigorous attempt to assess the evolution of freedom and prosperity around the world over the past three decades and the relationship between the two.
Free societies are defined by the interaction of political, legal, and economic institutions. Prosperous societies, in turn, are understood as those reaching broad and inclusive well-being. The Freedom and Prosperity Indexes bring these dimensions together in a transparent empirical framework, allowing researchers, policymakers, and advocates to compare countries, examine trends over time, and identify the institutional areas most in need of improvement.
The two Indexes are based on well-established theoretical definitions of freedom and prosperity, matched with respected empirical measures produced by international organizations, research institutes, and other data sources widely acknowledged as credible.1For a detailed explanation of the conceptualization of freedom and prosperity underlying the Indexes, see section 1 of the 2023 Freedom and Prosperity Report, and the chapter “Dimensions of freedom and economic performance” in the volume The Freedom and Prosperity Equation. For a detailed overview of the data sources and construction process of the Indexes, see our methodology. By measuring freedom as a set of rigorously defined institutional inputs, and prosperity as a set of social and economic outcomes, the Indexes make it possible to study how different dimensions of freedom and prosperity relate to and interact with one another.
The Freedom and Prosperity Center updates the indexes annually. The 2026 update covers 171 countries from 1995 to 2025. It introduces seven new countries: the Central African Republic, Eswatini, Fiji, the Maldives, the Solomon Islands, Somalia, and Timor-Leste.
The indexes continue to follow three guiding principles: transparency, simplicity, and consistency. The current iteration of the indexes has introduced minimal methodological improvements, mainly to strengthen theoretical and quantitative quality of the Legal Subindex (box 1).
The Freedom Index
The Freedom Index measures the institutional conditions that allow individuals to exercise political rights, live under the rule of law, and participate in economic activity guided by free and competitive markets through three equally weighted subindexes (figure 1).
Figure 1. The Freedom Index consists of three equally weighted subindexes

The Political Subindex measures the extent to which governments and lawmakers are responsive to citizens and respect individual rights and liberties. It captures whether political power is selected through competitive and inclusive procedures and is subject to institutional limits. The Political Subindex is calculated as the unweighted average of four components: elections, political rights, civil liberties, and legislative constraints on the executive.
The Legal Subindex measures the degree to which a country abides by the rule of law. It captures whether citizens and public officials are bound by clear and predictable laws, whether disputes are resolved by independent and effective courts, whether public administration is relatively free of corruption and bureaucratic abuse, and whether people can live and conduct economic activity under conditions providing basic security. The Legal Subindex is therefore composed of four equally weighted components: clarity of the law, judicial independence and effectiveness, bureaucracy and corruption, and security.
The Economic Subindex measures whether economic activity is guided by the principles of free and competitive markets. It captures the extent to which individuals and firms can own property, trade across borders, invest freely, and participate in economic life without legal or institutional barriers. The Economic Subindex is composed of four equally weighted components: property rights, trade freedom, investment freedom, and women’s economic freedom.
Together, these three subindexes provide a broad measure of institutional freedom. A country may perform well in one dimension and poorly in another, which is why the disaggregated structure of the Freedom Index is central to its value. Looking only at the aggregate score can obscure important differences in the internal composition of freedom, which can translate into different prosperity profiles.2For an analysis of how different institutional configurations affect the evolution of prosperity and its components, see the 2026 Atlas overview chapter. Section 2 in this report makes particular use of this structure, showing that the recent evolution of global freedom is not uniform across the Political, Legal, and Economic Subindexes.
Box 1. Methodological changes introduced in the 2026 update
- The 2026 update introduces three targeted methodological improvements. These changes do not alter the structure of the Freedom and Prosperity Indexes, but they strengthen the theoretical and statistical quality of specific components. A detailed explanation of the changes can be found in the Indexes methodology.
- First, the investment freedom component of the Economic Subindex has been revised. Investment freedom is difficult to measure because it can be affected not only by the formal legal framework governing investment but also by investor perceptions and isolated country-specific events. In previous editions, this component relied on a single source, which made the data more sensitive to short-term volatility and abrupt changes. The new version combines several indicators, including measures of capital account openness, financial openness, and investment restrictions. This broader construction reduces excessive jumps in the series and improves the component’s consistency with the rest of the Economic Subindex.
- Second, the security component of the Legal Subindex has been strengthened. The previous measure relied only on the World Bank’s Worldwide Governance Indicators (WGI) measure of political stability and absence of violence and terrorism. This remains a useful anchor because it provides broad country and time coverage and captures political instability and perceived risk. However, it does not fully capture everyday public safety or observed lethal violence from war, civil conflict, terrorism, homicide, and interpersonal violence. The revised component therefore adds a limited correction based on the Institute for Health Metrics and Evaluation violent-death data, combining deaths from interpersonal violence, conflict, and terrorism. The new specification keeps the WGI measure as the dominant source, while incorporating outcome-based evidence on actual violence. This improves the substantive validity of the component without creating a structural break in the Freedom Index.
- Third, the informality component has been removed from the Legal Subindex. Its original inclusion had a reasonable logic: informality can reflect whether laws governing formal economic activity are effectively followed and enforced. However, the component also presented important limitations. Informality is difficult to measure reliably, and data quality varies significantly across countries. In some cases, advanced economies may appear to have higher informality simply because they measure it better, not because informal activity is more prevalent. Removing this component improves the internal consistency of the Legal Subindex, both conceptually and statistically. The revised Legal Subindex now focuses more clearly on clarity of the law, judicial independence and effectiveness, bureaucracy and corruption, and security.
The Prosperity Index
The Prosperity Index measures whether societies can generate broad-based well-being for their citizens. While income is an essential dimension of prosperity, it is not the only one. A prosperous society is also one in which people live long and healthy lives, have access to education, enjoy a clean and sustainable environment, are treated equally under the law regardless of their identity, and benefit from economic gains that are widely shared. For this reason, the Prosperity Index is designed as a multidimensional measure that goes beyond economic output alone, formed by six equally weighted components: income, health, education, environment, minorities, and inequality (figure 2).
Figure 2. The Prosperity Index consists of six equally weighted components

The income component captures the material resources available to individuals in a given society. Income is a central part of prosperity, but it is not treated as synonymous with prosperity itself. Instead, in line with well-known authors and other measurement projects,3See Gunnar Myrdal, Asian Drama: An Inquiry into the Poverty of Nations (New York: Pantheon, 1968); Amartya Sen, Development as Freedom (New York: Alfred A. Knopf, 1999); and Mahbub ul Haq, Reflections on Human Development (New York: Oxford University Press, 1995). Their broader conception of prosperity informed measures such as the United Nations Development Programme’s Human Development Index and the Organisation for Economic Co-operation and Development’s Better Life Index. we consider health and education as complements of income. The health component measures the ability of individuals to live long and healthy lives. Education captures the extent to which people have access to knowledge and skills, essential for individual opportunity and for long-run economic development. We think of these three components together (income, health and education) as capturing a broad measure of individual well-being.
This broad view of individual flourishing is further complemented by the idea that well-being must be widely shared across the population, and sustainable. Three additional components of the Prosperity Index capture this vision: environment, income equality, and opportunities for minorities, by which we mean whether members of minority groups are able to participate in society without discrimination or exclusion. The environment component measures the quality and sustainability of the natural environment. The income equality component measures how broadly economic well-being is distributed.
Together, the six components provide a broad picture of prosperity as experienced by citizens. A country may have relatively high income but weaker performance in health, education, inclusion, or environmental quality. Conversely, some countries may achieve solid social outcomes despite more modest income levels. The disaggregated structure of the Prosperity Index allows these differences to be identified, making it possible to distinguish between prosperity that is narrow and prosperity that is broad-based.
Results of the 2026 Freedom and Prosperity Indexes
Freedom Index
The 2026 update of the Freedom Index shows a familiar global pattern. The countries at the top of the ranking remain concentrated in OECD economies. Denmark ranks first in 2025, followed by Australia, Estonia, Finland, Germany, Ireland, Luxembourg, Norway, Sweden, and Switzerland complete the top ten. At the other end of the distribution, the lowest freedom scores are found in countries marked by authoritarian rule, conflict, state fragility, or severe restrictions on individual rights, including Afghanistan, Eritrea, Iran, Myanmar, Somalia, Sudan, Syria, Turkmenistan, Venezuela, and Yemen.
Explore Freedom and Prosperity world map
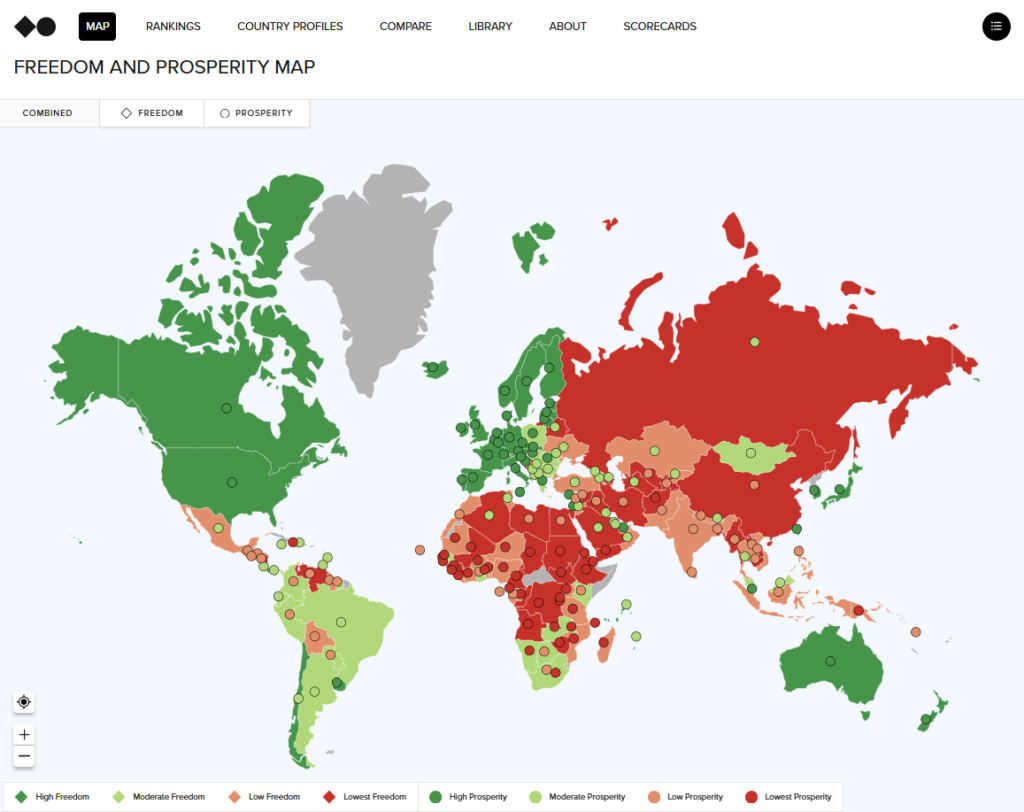
The Indexes rank 171 countries around the world. Use our site to explore thirty years of data, compare countries and regions, and examine the Subindexes and components that comprise our Indexes.
Regional differences remain large. Europe dominates the highest positions, while North America and Oceania also perform strongly. Other regions display more variation. Latin America and the Caribbean region show wide variation, ranging from high-performing countries such as Chile and Uruguay to very low-performing countries such as Nicaragua and Venezuela. Similarly, the East Asia and Pacific region combines high performers such as Australia, Japan, New Zealand, and South Korea with much lower-scoring countries such as China, Cambodia, and Myanmar. South and Central Asia remains generally lower-scoring as a region. The variability is also significant among large developing countries. Brazil, for example, remains in the moderate-freedom category, with a strong Political Subindex but weaker performance in the Legal and Economic Subindexes. China and Russia remain in the lowest-freedom category, driven primarily by very low Political Subindex scores and weak Legal Subindex performance.
Short-run changes in the Freedom Index tend to be modest because institutional indicators usually move slowly. Still, several countries registered notable changes in 2025 (figure 3). Mauritius was the largest improver, with a gain of more than seven points in its Freedom Index score. The change was driven mainly by the Political Subindex, which captures improvements in democratic guarantees after the country’s late-2024 election. South Korea also improved, recovering part of the ground lost in the previous update. Sri Lanka continued its recent recovery, while Syria appears among the largest improvers from an extremely low score and without changing its position near the bottom of the global ranking.
Figure 3. The world’s top movers in Freedom Index, with varying baseline
On the negative side, Guinea-Bissau and Niger recorded the largest one-year declines. Niger’s fall reflects the continued institutional effects of the 2023 coup, while Burkina Faso remains among the lowest-ranked countries after years of military rule and instability. Ecuador and Tanzania and also declined notably. The United States appears among the largest decliners in 2025, losing 4.7 points in the Freedom Index.4Because of its importance and the size of the change, we are preparing a country-specific analysis of the US situation to be published soon.
These one-year movements are important, but they should be interpreted in the context of deeper trends unfolding over the next years. The aggregate Freedom Index remains relatively stable, but its internal composition tells a more concerning story. Since 2012, the Political Subindex has followed a clear downward path. By 2025, the global average Political Subindex had returned to roughly its level at the end of the 1990s. This decline remains the clearest and most persistent sign of global freedom erosion.
The Economic Subindex presents a different picture. Since 1995, it has improved substantially and has helped offset part of the fall in the Political Subindex. Yet the pace of improvement has slowed. Since 2012, the global Economic Subindex has increased by only a little more than two points, and since 2020 it has been almost flat (figure 4). The Legal Subindex, meanwhile, had long appeared more stable than the other two. That stability is now less reassuring. Since 2020, the global average Legal Subindex has declined by more than one point, a fall of roughly 2 percent from its 2020 level.
Figure 4. Political Freedom has declined since 2012, while the rule of law, as measured by the Legal Subindex, has deteriorated since 2020
This means that the story told in previous reports, a declining Political Subindex being offset by rising Economic Subindex and the Legal Subindex staying mainly flat, still holds, but now requires a sharper interpretation. Political erosion continues and remains widespread. Instead, the Economic Subindex is no longer improving with the same strength as before, and the Legal Subindex has begun to weaken.
The following paragraphs examine each of these developments in turn:
- The Political Subindex continues to be the main source of global freedom decline. The drop is not confined to one region or to a small number of countries. It reflects a broad pattern of weaker electoral competition, pressure on civil liberties, and constraints on political rights. Some countries did improve in 2025, as seen before, but these improvements are not large enough to reverse the global trend. The overall picture remains consistent with the democratic recession documented in previous editions of this report,5See the 2025 Freedom and Prosperity Report for an in-depth analysis of how the erosion of political freedom is widespread across regions and income groups. affecting both OECD and non-OECD economies very significantly, although with different timing and magnitude (figure 5). In the former group, the decline is sustained since 2012, while in the latter it strongly accelerates around the COVID-19 crisis. Together with a much lower starting level among non-OECD economies, this implies a larger relative fall since 2012 (4 percent vs. 7.8 percent).
Figure 5. Non-OECD economies have experienced nearly twice the relative decline in political freedom since 2012
- The Economic Subindex evolution requires a more nuanced reading. At first glance, economic freedom appears to be the most positive part of the global freedom story because, since 1995, Economic Subindex score seems to have increased much more than Political or Legal Subindexes. However, the aggregate improvement of the subindex is driven in large part by the component measuring women’s economic freedom. Because women’s economic empowerment has risen sharply over the past three decades—reflecting major legal and institutional improvements in women’s ability to participate in economic life—the underlying flatness of the Economic Subindex is masked. If we focus only on the components of the Economic Subindex directly related to “core” economic policies—property rights protection, trade and investment openness— we observe stagnation since 2012, and a slight decline since 2021. Among non-OECD economies, core economic freedom in 2025 is essentially at its 2012 level (figure 5).
Furthermore, this stagnation may understate the current challenge given that some underlying data sources used in the Economic Subindex do not yet fully capture the most recent years.6For example, the last update of Fraser Institute’s EFW Index, the main source for the components of trade freedom and property rights, only reach the year 2023. As a result, the recent wave of protectionism, industrial policy, trade restrictions, and investment barriers may not be fully reflected in the 2025 scores. The Economic Subindex therefore remains higher now than in the 1990s, but its recent trajectory suggests that the long period of steady economic liberalization has slowed and may be weakening.
- The Legal Subindex is the most important new insight in the 2026 update. In earlier reports, the relative stability of the Legal Subindex suggested that global freedom erosion was primarily political.7This was also an artificial property of the Legal Subindex, produced by the features of one of the sources used, namely the World Bank’s WGI, which normalized scores to maintain a constant global average. The newest version of this source has fixed this undesirable characteristic, unveiling richer long-run dynamics. That conclusion is now harder to sustain. The decline in the Legal Subindex is still moderate in global terms (1.24 points), but a deeper analysis shows that the deterioration of the rule of law is now an evident trend.
Political erosion continues and remains widespread. Instead, the Economic Subindex is no longer improving with the same strength as before, and the Legal Subindex has begun to weaken.
The pattern for OECD economies is especially striking. Since 2012, the average Legal Subindex among OECD economies has fallen by about four percentage points, a decline proportionally larger than that in the political subindex over the same period (figure 6). The largest OECD declines in the Legal Subindex are observed in Belgium, Canada, France, Israel, Mexico, the Netherlands, Poland, Portugal, Slovakia, Turkey, the United Kingdom, and the United States. These countries differ widely in their political systems and recent histories, but many share a common pattern: political polarization, populist pressure, or institutional conflict has been accompanied by weaker legal predictability, challenges to judicial independence, or a deterioration in public order.
The non-OECD pattern is different but no less important. The Legal Subindex decline is smaller and more recent, beginning mainly after 2020. But non-OECD economies start from much lower Legal Subindex levels (average Legal Subindex score for OECD economies is 75, while it is only 50.3 for non-OECD economies). For that reason, stagnation or reversal is a major development concern. Countries such as Burkina Faso, Ecuador, El Salvador, Georgia, Indonesia, Myanmar, Nicaragua, Peru, Sudan, and Tunisia have experienced notable Legal Subindex declines since 2020. In several cases, these changes reflect coups, conflict, or attacks on institutional checks and public security.
Figure 6. The global average rule of law score has declined since 2020
The timing of the Legal Subindex decline matches fairly well that of the Political Subindex (2012 among OECD, 2020 among non-OECD), which could be consistent with the concern that political erosion has spilled into the legal pillar. It is still early to empirically test this hypothesis, but the pattern is suggestive. When democratic norms weaken, courts, legislatures, bureaucracies, and other checks on executive power often become more vulnerable. Legal institutions depend not only on formal rules, but also on political actors willing to respect those rules.
Another sign that reinforces the intuition that political erosion could be spilling over into legal institutions is the fact that, at the component level, the decline is concentrated in the areas most closely connected to institutional predictability and checks on power. In OECD countries, clarity of the law has fallen sharply since 2012, while judicial independence and effectiveness has also declined. Security has deteriorated as well, especially since 2020, but the longer-run legal decline is most clearly associated with the former two attributes (figure 7). In non-OECD economies, the post-2020 decline is also visible in clarity of the law and judicial independence, while bureaucracy and corruption and security are closer to flat on average.
Figure 7. Declining clarity of law is the primary driver of rule of law deterioration in both OECD and non-OECD economies
These findings carry significant policy implications, and they are the reason for this report’s focus on legal institutions as fundamental drivers of prosperity in the analysis that follows. The Legal Subindex is not only another component of institutional freedom. It captures the rule-of-law foundations that make political and economic reforms meaningful: clear rules, credible courts, reliable administration, and basic security. Political freedom remains under pressure, economic freedom is less dynamic than the aggregate score suggests, and legal institutions are now showing signs of erosion.
The next section turns briefly to the Prosperity Index before the report examines the relationship between legal institutions and prosperity in greater detail.
Prosperity Index
The 2026 update of the Prosperity Index also shows a stable cross-sectional pattern. The highest levels of prosperity remain concentrated in advanced economies, especially in Europe. Norway ranks first in 2025, followed by Denmark, Iceland, Ireland, Sweden, Switzerland, Belgium, Finland, Slovenia, and the Netherlands. North America and several high-income economies in East Asia and the Pacific also perform strongly. At the bottom of the ranking are countries affected by extreme poverty, conflict and state fragility, such as the Central African Republic, Chad, the Democratic Republic of the Congo, Haiti, Madagascar, Mozambique, Niger, Somalia, South Sudan, and Sudan.
Explore Freedom and Prosperity world map
The Indexes rank 171 countries around the world. Use our site to explore thirty years of data, compare countries and regions, and examine the Subindexes and components that comprise our Indexes.
Regional differences remain large. Europe and North America have the highest average prosperity scores, followed by the Middle East and North Africa (thanks to the strong performance of the Gulf monarchies in some components), East Asia and the Pacific, and Latin America and the Caribbean. The South and Central Asia region remains below the global average, while sub-Saharan Africa continues to face the deepest prosperity challenges. As with the Freedom Index, the Prosperity Index is less useful for interpreting short-run institutional movements. Many prosperity components move slowly, and some underlying data sources are not yet available through 2025. For this reason, the most relevant story is not year-to-year change, but the uneven composition of long-run prosperity gains.
Since 1995, the global average Prosperity Index has increased by almost ten points. This improvement is real and substantial. But it is not evenly distributed across the six components. The strongest and most persistent gains are found in the dimensions most directly associated with individual well-being: education, health, and income. Between 1995 and 2025, global education scores increased by almost 18 points; health increased by more than 16 points; and income increased by more than 10 points. These trends reflect the broad improvement in living standards, human capital, and life expectancy observed across much of the world over the past three decades, and especially in many developing countries reaping the early fruits of fast economic development.
The picture is less encouraging for the components that capture shared and inclusive prosperity. The environment component improved, but by less than income, education, or health. Inequality improved only modestly. The minorities component shows the weakest long-run progress and has declined since 2012. In other words, the world has become more prosperous in the aggregate, but prosperity has advanced more clearly in individual well-being than in the dimensions that measure whether gains are inclusive, widely shared, and socially sustainable.
This difference is visible when the components are grouped into two broad categories (figure 8). The average of income, education, and health increased from 53.2 in 1995 to 68.2 in 2025. By contrast, the average of environment, minorities, and inequality increased only from 60.4 to 64.8 over the same period. Since 2012, the contrast is even clearer: Individual well-being improved by 4.5 points, while shared and inclusive prosperity improved by only 1.3 points.
Figure 8. Prosperity Index scores have improved, but gains remain uneven across dimensions
The comparison between OECD and non-OECDC economies reinforces this interpretation. Non-OECD economies have made important progress in health and education, consistent with gradual convergence in basic well-being. OECD economies continue to perform at much higher levels overall, but their shared and inclusive prosperity components have also been comparatively flat (figure 9). The minorities component has declined since 2012 in both OECD and non-OECD economies. This suggests that the challenge of building broad prosperity is not confined to developing countries. Even where income, health, and education are high or improving, inclusion and shared gains remain harder to secure.
Figure 9. Overall prosperity has improved, but progress has varied considerably across components
This uneven pattern provides the background for the analysis section of the report. The central question is not only whether societies become richer, healthier, or better educated, but whether prosperity becomes broad, resilient, and inclusive. The next section examines why legal institutions may be especially important for that broader form of prosperity.
The rule of law as a foundational pillar of prosperity
The previous section showed that the recent erosion of freedom is no longer confined to the Political Subindex. The Legal Subindex is now also showing signs of score deterioration both across OECD and non-OECD economies, though the timing of declines differs between the two groups. Score deterioration on the Legal Subindex is particularly steep across components measuring institutional predictability and checks on executive power. This development is critical because legal institutions play a distinctive role in the relationship between freedom and prosperity.
The scope of the Legal Subindex used in the Freedom Index is deliberately narrow. It follows a thin and formal understanding of the rule of law: Citizens and public officials are bound by laws that are relatively clear, stable, public, and generally enforced. This choice differentiates the Legal Subindex from the Political and Economic Subindexes, which measures democratic rights, market institutions, trade policies, property rights, and women’s economic rights. By contrast, the Legal Subindex measures whether laws and regulations are effectively and generally enforced, irrespective of what those laws actually say.
This distinction is important. If the rule of law were defined too broadly, it would overlap with the other two pillars of freedom. Including civil liberties and political rights would blur the distinction with the Political Subindex; and including property rights and contract enforcement would blur the distinction with the Economic Subindex. A narrower definition allows us to isolate the legal dimension more clearly and analyze how it relates to prosperity, both directly and in interaction with the other pillars. In this sense, the Legal Subindex captures the institutional environment in which individuals, firms, and governments can plan, invest, enforce rights, and implement policy.8Our understanding of the rule of law is by no means original, but it is grounded in the work of well-known scholars. Most notably, Joseph Raz famously argued that the rule of law is a formal virtue of a legal system which value lies in making the exercise of public power more predictable and less arbitrary. In a similar spirit, F. A. Hayek described the rule of law as a condition in which government action is bound by rules fixed and announced beforehand, allowing individuals to foresee how public authority will use its coercive powers and to plan their affairs accordingly.
The rest of the section analyzes empirically the relationship between this conception of the rule of law and prosperity, with a special focus on non-OECD economies. The reason is not that legal institutions are unimportant in advanced economies; as shown above, the Legal Subindex has declined significantly in several OECD economies, and recent research suggests that it has had measurable costs.9See for example M. Morelli’s analysis on the economic costs of inefficient laws in the 2026 Atlas: Freedom and Prosperity around the world, and the references therein. Although focused on the Italian case, the same logic applies to most of the OECD economies.
But the development implications are especially important outside the OECD, where the Legal Subindex scores are much lower on average to begin with and where institutional weaknesses tend to represent a binding constraint on prosperity.10The overview chapter of the 2026 Atlas: Freedom and Prosperity around the world shows that non-OECD economies, the weakest institutional pillar is most commonly the Legal Subindex.
In these emerging economies, stagnation or reversal in the Legal Subindex is not simply another sign of institutional erosion; it limits the ability of societies to converge toward higher levels of prosperity.
A country’s legal institutions and prosperity are closely associated
A simple look at the data supports the relevance of the Legal Subindex. For the full sample of 171 countries in 2025, the correlation between the Legal Subindex and the Prosperity Index is 0.745, very close to the correlation of the economic subindex with prosperity, 0.763, and clearly above that of the political subindex, 0.557.
Among non-OECD economies, the correlation between the Legal Subindex and prosperity is 0.563, almost identical to that of the Economic Subindex, 0.562, and substantially higher than that of the Political Subindex, 0.322.11The correlation coefficient measures the strength of a linear association between two variables. It ranges from -1 to 1, with values close to 1 indicating that both variables are strongly positively associated, close to -1 that they are negatively associated, and values around 0 indicating that there is not a clear relationship. The smaller coefficient in the non-OECD sample is expected due to higher diversity in institutional development, but the relationship remains strong within this more demanding sample. One possible challenge is that the Legal Subindex may simply be a marker of broader institutional quality. Countries with better legal institutions tend to have higher political and economic freedom too, and the relationship with prosperity may be driven by this broader freedom bundle (box2). By removing both prosperity and the Legal Subindex—the components that can be statistically explained by the Political Subindex, the Economic Subindex, and regional characteristics—this concern can be addressed (figure 10). The remaining association is still positive and strong, with a partial coefficient of 0.55. In other words, legal institutions remain closely associated with prosperity even after stripping out the other two freedom pillars and regional differences. Legal institutions and prosperity still move together closely, and the relationship remains substantial in its own right.
Figure 10. The Legal Subindex still matters beyond the broader freedom bundle
Box. 2 Country-pair comparisons on the positive association between rule of law and prosperity
An intuitive way of visualizing the relation between legal institutions and prosperity is to compare countries with similar regional and institutional characteristics, but different Legal Subindex scores. In Latin America region, the Dominican Republic and Guatemala have relatively similar Political and Economic Subindex scores, but the Dominican Republic scores almost 11 points higher on the Legal Subindex. Its prosperity score is also 11.7 points higher. Malaysia and the Philippines show a similar pattern in Southeast Asia.
These examples are not causal tests, but they illustrate the broader pattern: where Political and Economic Subindex scores are similar, differences in legal institutions often coincide with large differences in prosperity.
The direct association between the Legal Subindex and prosperity seems thus supported by the data, which can be rationalized with the classic rule-of-law argument about predictability. But the initial discussion above points also to an indirect or instrumental relation between the rule of law and prosperity—in particular, to the idea of legal freedom as enabler and multiplier of the effects of other (substantive) freedoms on prosperity. Two possible complementarity mechanisms will be tested next.
The rule of law serves as the institutional threshold for prosperity
The first mechanism is the threshold effect, showing the necessary requirements for increased prosperity. The hypothesis is not that high performance on the Legal Subindex can guarantee prosperity, but that very low Legal Subindex scores sharply reduce the probability that a country reaches high prosperity.
This is especially apparent in the case of the subindex’s security component. Where violence, conflict, or generalized crime dominate public life, households and firms face high risks, governments struggle to provide basic services, and long-term investment becomes difficult. Under those conditions, improvements in other areas may have limited effects. The same logic applies, though less visibly, to legal predictability and public administration.
The data are consistent with this threshold hypothesis. Among non-OECD economies, high prosperity is rare in the bottom quartile of the Legal Subindex. Only about nine percent of countries in the lowest Legal Subindex quartile reach the top quartile of the non-OECD prosperity distribution (figure 13). The share rises as the Legal Subindex scores improve, reaching nearly half of countries in the highest Legal Subindex quartile. The pattern does not imply that legal institutions are the only determinant of prosperity, but it suggests that weak legal foundations make high prosperity unlikely.
Figure 13. High prosperity is rare where the rule of law is weak
The threshold effect is even clearer when looking at security (figure 14). The security indicator captures the state’s ability to provide public order and protect people from violence. A country may liberalize markets, hold elections, or improve formal rights, but if people cannot safely travel, work, invest, or participate in public life, prosperity will remain constrained. Among non-OECD economies, only 5.9 percent of those in the lowest security quartile reach the top prosperity quartile, compared with 54.5 percent among countries in the highest security quartile.
Figure 14. High prosperity is especially rare where security is weak
These results should be interpreted carefully, but they clearly suggest that legal institutions are a necessary—though not sufficient—condition for prosperity. The Legal Subindex should, therefore, be understood as an institutional threshold. It does not automatically produce prosperity, but without it, prosperity is much harder to sustain.
The Legal Subindex as an enabling condition for economic freedom
The second mechanism also relates to the idea of complementarity (that is, how one institution can make another more effective). In this case, the strength of a country’s legal institutions matters directly, but also influence the extent to which other freedoms generate prosperity, especially economic freedom.
The intuition is straightforward. Property rights require courts and administrative institutions capable of protecting ownership. Trade and investment require rules that are transparent and relatively stable. Entrepreneurs need to know that contracts will be enforced and that regulations will not be applied arbitrarily. Women’s economic rights require not only formal legal recognition, but also effective implementation and protection against discriminatory practices. In each case, economic freedom is more than the absence of formal restrictions. It also depends on whether the legal system allows individuals and firms to use those freedoms with confidence.
This is why economic liberalization may fail to deliver results in weak legal environments. A country may reduce barriers to trade or investment, but if corruption remains widespread, courts are unreliable, or public officials apply rules unpredictably, the gains from reform may be limited. Conversely, when legal institutions are stronger, economic freedom is more likely to generate investment, innovation, employment, and higher living standards.
Economic freedom appears to work best where legal institutions are strong enough to support it.
We test this hypothesis with a simple interaction model with controls for the non-OECD sample. Figure 15 presents the main result: the marginal effect of Economic Subindex on prosperity increases with high performance on the Legal Subindex. That is, a given improvement in economic institutions is more closely associated with higher prosperity where there is greater adherence to the rule of law. In countries with very weak Legal Subindex scores, rising Economic Subindex scores are not significantly associated with higher prosperity. As Legal Subindex scores rise, the association between the Economic Subindex and prosperity becomes stronger. In other words, economic freedom appears to work best where legal institutions are strong enough to support it. This figure should be interpreted as evidence of conditional association, not as proof of a mechanical causal effect. Still, the pattern is substantively important.
Figure 15. Economic freedom pays off more where the Legal Subindex score is higher
A similar exercise testing the interaction between legal and political freedoms shows that the complementarity effect is less clear for the Political Subindex. This does not mean political freedom is unimportant, as we have shown in previous reports. In any case, the empirical pattern suggests that, in the non-OECD cross-section, the enabling-condition logic is more visible for the Economic Subindex.
Box 3. Legal institutions and the breadth of prosperity
The global gains in prosperity have been uneven. Income, education, and health have improved substantially over the past three decades, while components linked to shared and inclusive prosperity have improved less or even weakened. This raises a further question: Are legal institutions associated only with income, or also with broader dimensions of prosperity such as better health and education outcomes and lower inequality?
Figure 16 presents a heatmap based on separate regressions of each prosperity component on each Legal Subindex component, controlling for the Political Subindex, the Economic Subindex, and region. Each cell shows the estimated association between one legal component and one prosperity component. The figure should not be read as a causal decomposition, but as a way to identify which legal channels are most closely associated with different aspects of prosperity.
Figure 16. Legal Subindex components are linked to different dimensions of prosperity components
The broadest associations are found for security and bureaucracy and corruption. Countries with stronger scores in these components tend to score higher not only in income, but also in health, education, environment, and minority protections. Clarity of the law and judicial independence and effectiveness appear more selective, but still relevant, especially for income and minority protections. Overall, the component-level evidence reinforces the central argument of this section: Legal institutions matter through security, predictability, administrative capacity, and enforcement.
The overall conclusion of the previous analysis is straightforward. The Legal Subindex does not replace the Political or Economic Subindexes. It complements them. It provides an institutional Threshold below which high prosperity is rare, and it creates the conditions under which economic freedom can generate stronger prosperity gains. For non-OECD economies, where the Legal Subindex scores remain much lower and recent stagnation is especially concerning, strengthening legal institutions should be seen as a central part of any long-term prosperity strategy.
Conclusion: Rebuilding the foundations of prosperity
The 2026 Freedom and Prosperity Indexes show that freedom’s erosion is entering a new stage. Political freedom continues to decline around the world, as previous editions of this report have documented. But the deterioration is no longer confined to the political sphere. Core economic freedom has lost momentum, and the Legal Subindex is now visibly weakening. This matters because legal institutions have often acted as guardrails that contain political backsliding and preserve the conditions for prosperity.
The evidence shows why this legal deterioration should be treated as a major warning sign. Legal institutions are closely associated with prosperity, especially among non-OECD economies. High prosperity is rare where the Legal Subindex is weak, and rarer still where insecurity is prevalent and the security component of the Legal Subindex is correspondingly weak. The evidence also suggests that economic freedom works best when legal institutions are strong enough to support it. Markets, investment, and entrepreneurship require rules that are predictable and enforced with some degree of fairness.
The policy message is therefore clear. Countries with weak legal institutions should not treat rule-of-law reform as secondary to economic development. It is part of the development process itself. Where courts are ineffective, laws are unstable, public administration is captured, or security is fragile, reforms in other areas are less likely to deliver their expected benefits. Strengthening legal institutions should be central to any strategy aimed at durable prosperity.
Advanced economies also face a warning. Legal foundations can erode even where democratic and market institutions are long established. Polarization, populism, and institutional conflict can weaken the checks that once contained political deterioration. Protecting judicial independence, legal predictability, and public-sector integrity is therefore not only a matter of institutional tradition. It is a condition for preserving freedom and prosperity in a more unstable world.
In the current geopolitical environment, countries cannot afford to neglect the importance of the rule of law. The societies best positioned to remain free and prosperous will be those that protect the legal foundations on which both freedom and prosperity depend.
Read the Freedom and Prosperity Indexes methodology
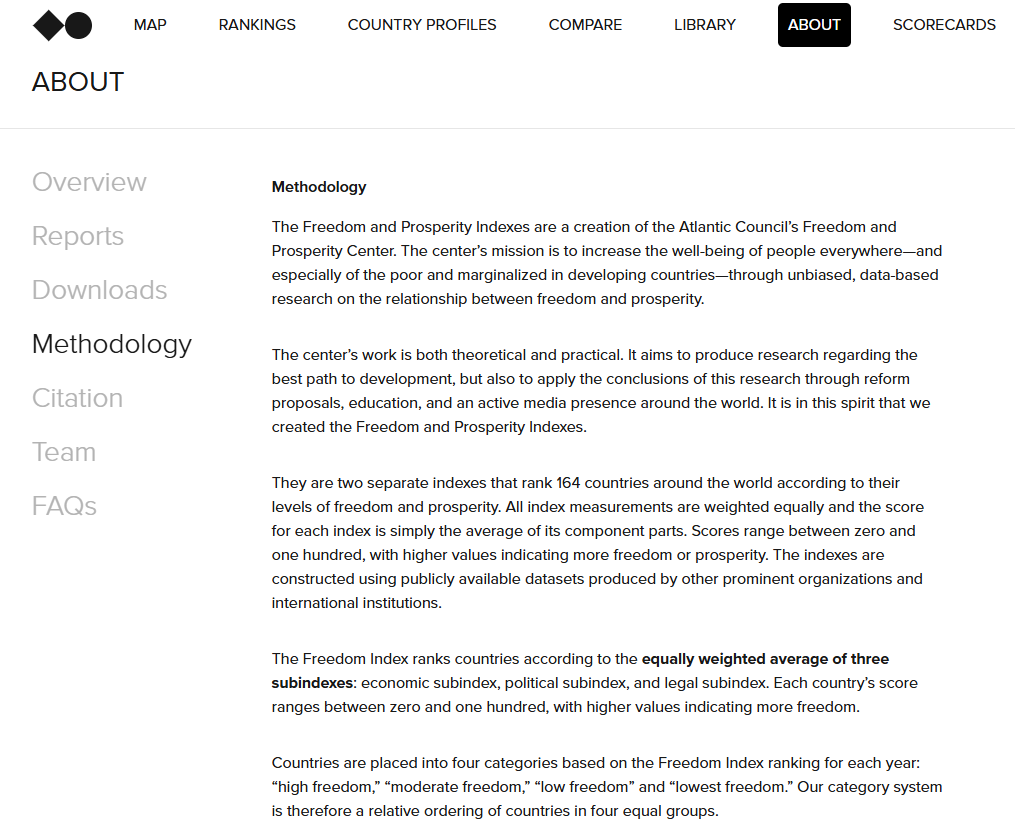
The Indexes rank 171 countries around the world. Use our site to explore thirty years of data, compare countries and regions, and examine the subindexes and indicators that comprise our Indexes.
Authors





Acknowledgements
We would like to thank Poppy Hendrickson, Will Mortenson, and Moussa Traoré for their valuable contributions. We also extend our gratitude to Mary Kate Aylward, Beverly Larson, Andrea Ratiu, and Romain Warnault for their support.
The Atlantic Council’s Freedom and Prosperity Center, which produces the Indexes annually, studies how political rights, economic freedom, and the rule of law shape human well-being and economic growth. The Center ranks 171 countries using thirty years of data and presents the results in interactive format for researchers, policymakers, and the public.
Related content




Explore the program
The Freedom and Prosperity Center aims to increase the well-being of people everywhere and especially that of the poor and marginalized in developing countries through unbiased, data-based research on the relationship between prosperity and economic, political, and legal freedoms, in support of sound policy choices.