Getting ahead of the crisis: Global food security during COVID-19
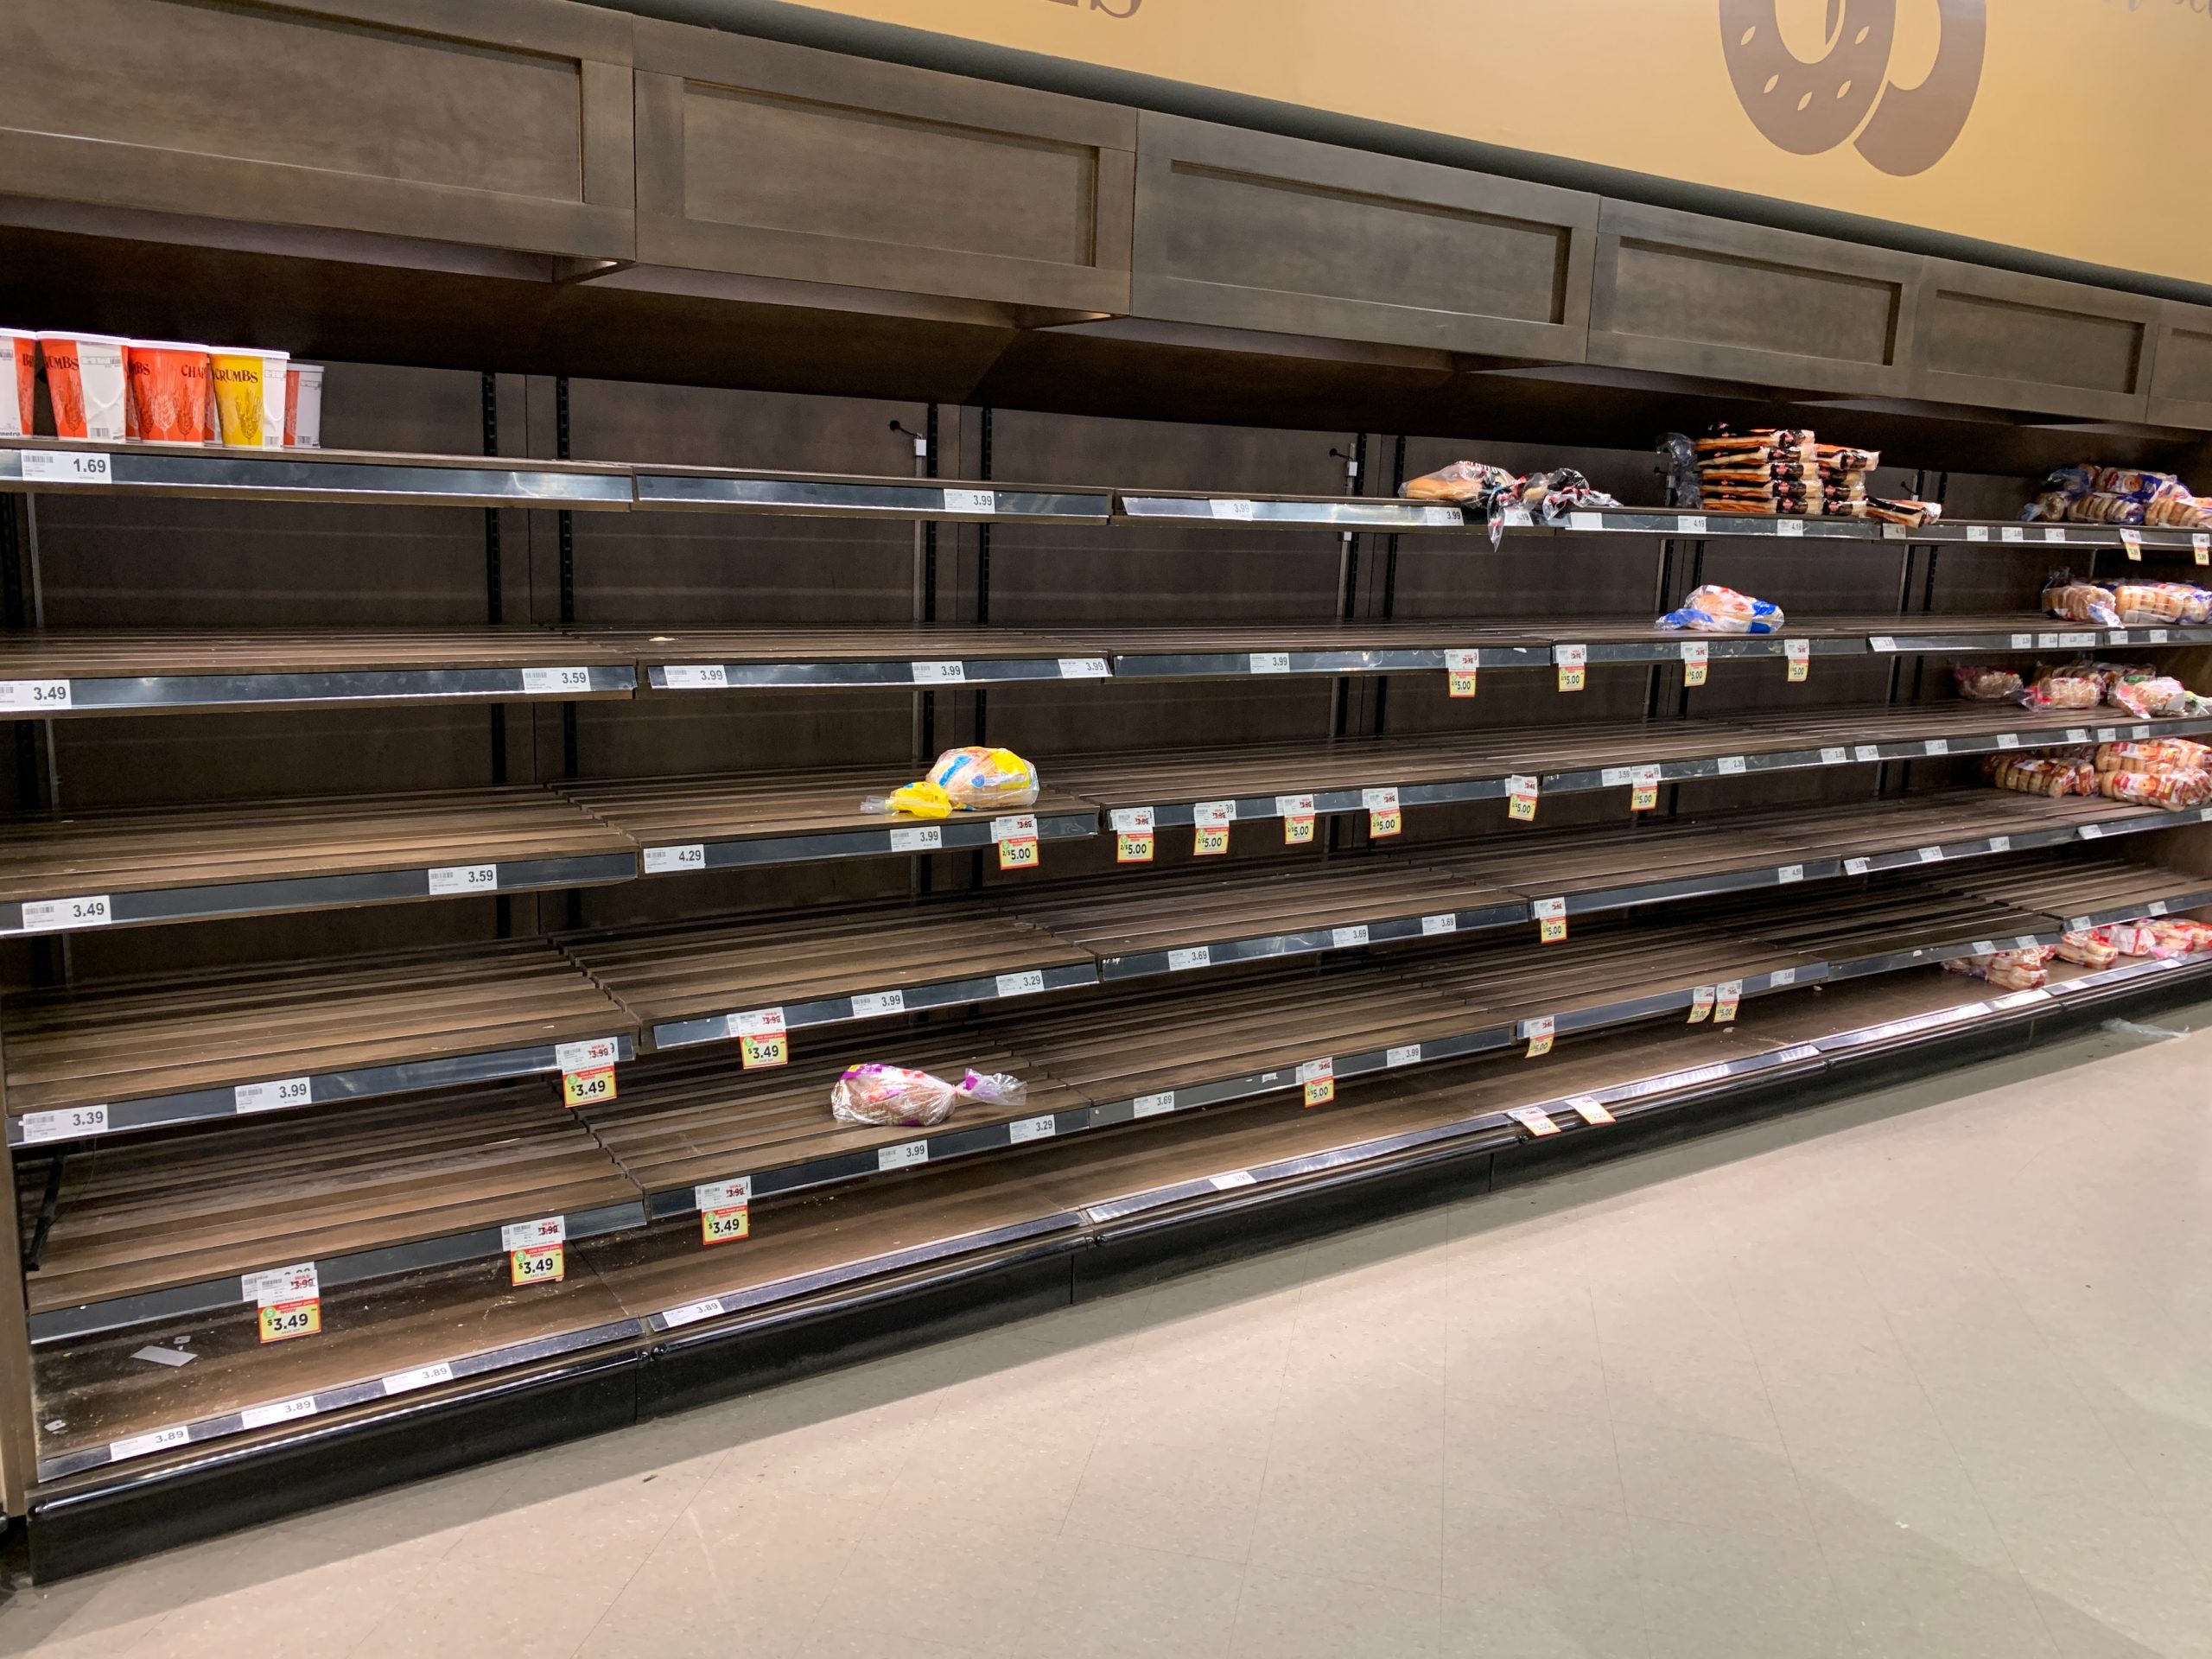
The ongoing spread of the novel COVID-19 is, first and foremost, a global health crisis. In an attempt to flatten the curve and to save health care systems from being overwhelmed, authorities around the world are imposing drastic measures on their societies: From lock-downs to border closures to curfews, the commandment of the hour is social distancing. Much has been written about the economic consequences of such policies; less attention, however, has been paid to emerging issues like food security in the age of a global pandemic.
Why food security matters too
Food security is certainly a crucial issue because COVID-19 is also a crisis of logistics – whether it is with regard to necessary medical equipment, labor availability, or food supplies. To put it simply, things aren’t always where they are needed most, and the imposed travel restrictions and border closures will most likely impact global supply chains too.
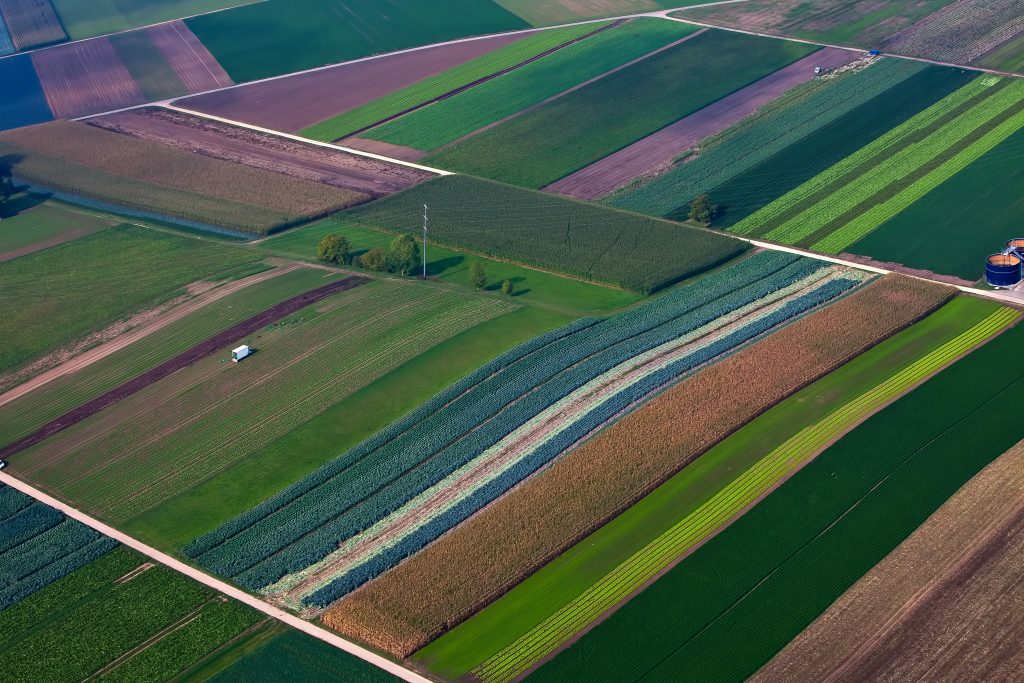
Countries like Germany and the United Kingdom, for instance, have already started initiatives, trying to replace thousands of foreign workers who usually make their way across Europe during harvest season. Individual examples that shine light on a bigger question: Assuming the intensification of the COVID-19 crisis, which countries, islands, and areas are at risk of running out of food, and potentially need “aliment airlifts” (or even better, “shiplifts”) during the pandemic?
This study is an attempt to get ahead of the geopolitical ramifications of the COVID-19 crisis. Food shortages risk regional instability. At the same time, those nations that do have more food than they need can assist those nations and societies during this global crisis. We at the GeoTech Center are committed to identifying how new technologies and data can benefit people, prosperity, and peace.
As part of an ongoing endeavor, the Atlantic Council’s GeoTech Center is analyzing available data. The main idea of the project is thereby to evaluate the crisis-effect on countries that usually enjoy food security and whose status could change because of border closures.
Preliminary results
Our first estimates, displayed below, look at each country under the assumption that both import and export of food ceases – a scenario that affects both the developing and developed world. Results are provided in two formats:
- For those who are mainly interested in the findings, the following maps (which indicate a before and after import/export removal) are where to look.
- Others might be eager to learn about the calculations, methods, and the dataset itself – be it to understand the analysis in more detail or extend the research.
That’s why a more sophisticated guide to the data and its application can be found below the illustrations. Also note: our analyses are irrespective of the acknowledgement that there are regions of the world where people are already starving, despite actual food availability, see, for example, the Global Hunger Index.
Estimated food balance sheet with imports and exports removed
Estimated food balance sheet before import/export removal
Food balance changes
Food security during COVID-19 – a rough data guide
The purpose of this study was to find countries and areas that might need food security support. We needed rough estimates quickly, so we looked for existing calculations of food supply, distributions and needs (a.k.a. food security and food self-sufficiency), across countries and regions of the world. Some of these were:
- The Economist’s food security index
- Concern Worldwide’s Global Hunger Index
- The World Bank’s food export data
- The USA food trade data
- United Nations Strategic Development Goal 2.1.1
- United Nations Food Insecurity Experience Scale
- United Nations FAO’s Food Balance Sheets
Methodology
To estimate the effect of the worst-case scenario, meaning all borders being closed, we needed to remove food imports and food exports from the calculations behind these existing figures. We did this for as many countries in the world as we could. The dataset that best fitted those criteria was the FOA’s Food Balance Sheets, available for 209 counties and regions of the world (175 countries and territories, 34 regions), including raw data on production, imports and exports, at http://www.fao.org/faostat/en/#data/FBS. The exact calculations and approximations we used are available in our github repository. In summary, however, what we did was:
- We used the food supply (“dietary energy supply”) in kilocalories per capita per day as an estimate of food security, meaning an estimate of average calories available to each person in a country per day. That calculation doesn’t take into account factors like demographics (e.g. different calorie needs), unequal distribution of food, and seasonality etc., but it’s a good start.
- We recalculated the kilocalories per capita per day for each food item group. Item groups (e.g. “Starchy Roots”) each include several crops (e.g. Cassava, Potatoes, Roots, Sweet potatoes, Yams) – the FAO lists production, import, export, and other numbers for each of these. The main changes we made in these calculations were to remove imports and exports from the estimates of products available; to not allow the estimate of products available to humans to become negative (that’s why the loss equations aren’t exact); and to use earlier figures to estimate the conversion from Tonnes to kcalories.
- We summed the kilocalories per capita per day for each food item group, to give a total food supply estimate for each country. We output the original food supply estimates for 2017 (the latest date available in the FAO dataset) and created new estimates for 2017 with imports and exports removed, for each country. We included that data in a Tableau map visualization above.
- We colored the map visualization by whether countries are below two thresholds or not: 1200 kcal/cap/day and 1800 kcal/cap/day. Simplistically, food security is a combination of calories available and calories needed. Two estimates of calories needed are minimum dietary energy requirement (MDER – the calories to maintain minimum acceptable weight for height) and average dietary energy requirement (ADER – calories to maintain energy balance, i.e. normal lifestyle), usually estimated for each country as a sum across each of its demographics (gender, age, levels of activity). We’ve used estimates of 1200 and 1800 (from Refinements to the FAO methodology) for these figures.
In some countries, not much changed. In others, kcal/cap/day rose dramatically, e.g. Canada rising from around 3000 kcal/cap/day to around 18000. Others moved from food-secure to food-insecure, meaning an aliment production that provides below 1200 or 1800 kcal/cap/day. Notably, many of those were oil-producing countries.
Limitations and future work
- Geographical coverage: Unfortunately, this dataset doesn’t cover every country in the world. Further research could be conducted about countries that are left out, including additional thinking about how we could create or proxy estimates for them.
- Time: These approximations are based on 2017 numbers. They’re not that old, but climate effects on crops have moved quickly in the past couple of years. Usually food security calculations are averaged over three years to get a smoothed annual score: we haven’t done this yet (we only estimated from 2017 figures), but should.
- Granularity: We’re only using the top level of the FAO’s Item Group hierarchy in our rough calculations. Given the nature of this project, doing them over all possible items seemed a little over the top, but this could be done too with the same code. We’re also approximating the calculation from tonnes to kCalories for each food group in each country. The real tables for this calculation exist. They are painful, but could, of course, be used instead. We’ve left the loss residuals as-is, even though we know they’re calculated in some dystopian way. And we don’t allow the food available to humans to go below zero, to keep the output numbers sane; doing this doesn’t allow for all cases, including that people might not be able to feed animals, or keep back seed for next year; this part of the calculations needs serious revisiting.
- Input accuracy: Some of the original numbers look a little healthier than expected. One might need to be cautious with any self-reported data, and further cross-check against other sources certainly helps.
- Within-country distribution: We haven’t covered food distribution issues within countries if e.g. “cordons sanitaire” are created around states and other territories. We could recalculate the FAO parameter ‘Coefficient of variation of habitual caloric consumption distribution’ using country-specific data (e.g. regional agriculture data). We could also revisit UN SDG 2.1.1 and its inclusion of availability in its hunger calculations.
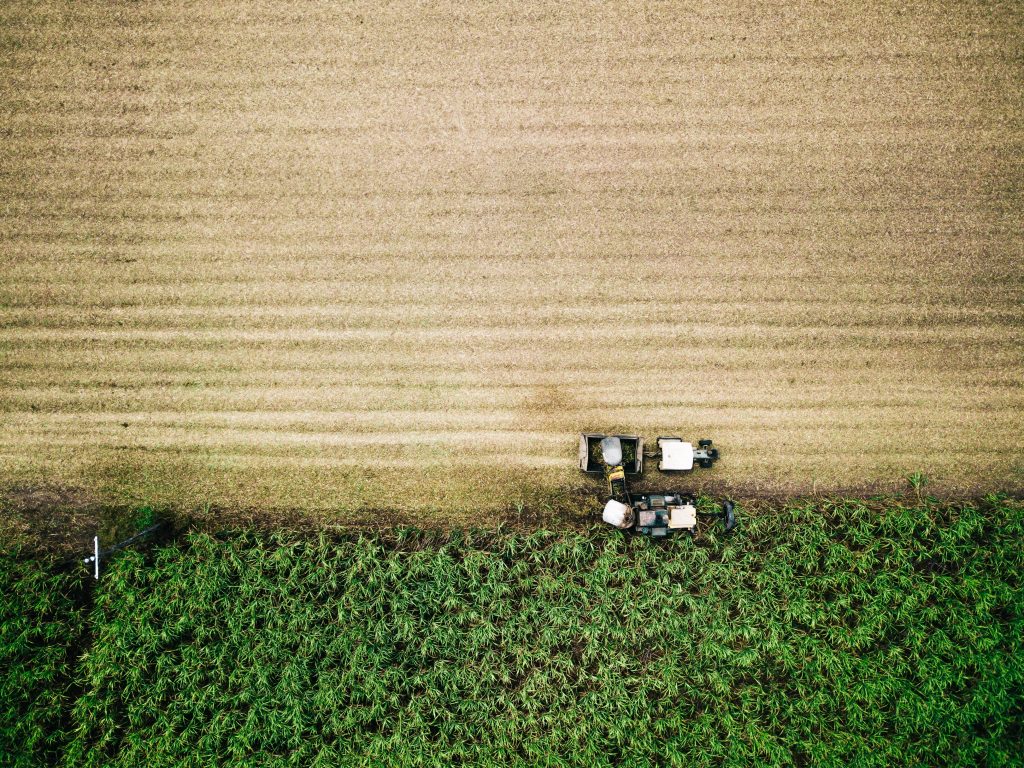
- Population effects: We haven’t allowed for the effect of food products not being available because there aren’t workers available to harvest or process them, either through illness or because seasonal migrant workers aren’t able to reach the countries they usually work in. One interesting extension study would be looking at which populations are dependent on foods that need continual harvesting (e.g. fish) and the potential effects on them of reduced available manpower (This isn’t just a developing world issue: US and UK news articles have already appeared talking about farm labor shortages). We’ve left tourist food estimates in the current calculations, because we weren’t sure which assumptions to make about this, between “there won’t be tourists” and “there will be extra population because people fled to their island holiday homes.” One could, of course, revisit the tourist food estimates as the location of populations becomes clearer.
- Quality of food: FAO also has fat and protein figures for each food that one could investigate.
- Additional potential investigations: Other potential supply issues include agricultural distribution issues in and between countries when supply-chains are focused on medical and essentials. Other potential investigations include thinking about which foods are continuously-gathered, seasonal etc. to see if there are seasonal drops in kcal/capita/day that we need to think about, too.
Concluding thoughts
Food security is interlinked with other COVID-19 issues, including people and energy security. It is safe to say that the production of some food takes more human labor than the production of other. For example, a fishing-based area will need boats to go out and catch fish, and if a large number of fishermen are sick, that will affect the food supply in a way that a potato-farming area, for instance, won’t see.
Seasonalities will matter, too. The rough calculations done on annual figures could also be broken down into calories available at different times of the year, as crops come in (and stockpiles dwindle). Farmers or areas might have to make decisions based on crop calorie values per human effort in maintaining and harvesting them. Geopolitics might once again be affected by land and food. And many of the major oil-producing countries are potentially affected by this, too — with wide ranging effects.
If you have feedback, questions, or ideas for further collaboration, please reach out to us. All the code for this work can be found at https://github.com/ACGeoTech/Covid19_FoodSecurity.
This study is an attempt to get ahead of the geopolitical ramifications of the COVID-19 crisis. Food shortages risk regional instability. At the same time, those nations that do have more food than they need can assist those nations and societies during this global crisis. We at the GeoTech Center are committed to identifying how new technologies and data can benefit people, prosperity, and peace.


The GeoTech Center champions positive paths forward that societies can pursue to ensure new technologies and data empower people, prosperity, and peace.