
Introduction
The aim of this chapter is to analyze the relationship between freedom and prosperity, inspired by the neo-institutionalist approach, which proposes a relationship between cause and the positive effect of freedom on prosperity. The first section presents the neo-institutionalist perspective, drawing on the work of North,1Douglass C. North, Institutions, Institutional Change and Economic Performance (Cambridge: Cambridge University Press, 1990). and Acemoglu and Robinson.2Daron Acemoglu and James A. Robinson, Why Nations Fail: The Origins of Power, Prosperity and Poverty (New York: Crown Business, 2012). A brief review of the empirical literature follows, with the aim of presenting the different methodological strategies used in assessing freedom and prosperity, and exposing the lack of studies employing the Atlantic Council’s own indicators. The following section details the methodological procedures used in the present study. They involve the analysis of panel data for (a) testing the existence of cause-and-effect relationships between freedom (and its components) and prosperity, and (b) testing the temporal precedence between the two variables. With the methodology presented, we move on to analysis and discussion of the results, and a final section summarizes the work and provides some final remarks.
The New Institutional Economics: The theoretical perspective
To understand the relationship between freedom and prosperity it is necessary to rescue the discussion about how institutions affect freedom. For North, institutions are the formal and informal rules in force in each society.3North, Institutions, Institutional Change . . . Formal institutions are created rules, such as laws and regulations. Informal institutions, on the other hand, are those rules that evolve over time, such as conventions and codes of conduct. Thus, institutions establish restrictions on what individuals can do and on the conditions under which certain activities can be carried out. In this way, institutions reduce uncertainties and provide a stable (but not necessarily efficient) structure, shaping the incentive system and shaping human interaction. By affecting transaction and production costs they impact economic performance and, consequently, prosperity.
The key, therefore, is to understand how institutions affect transaction and production costs. In this context, Acemoglu and Robinson distinguish “inclusive economic institutions” from “extractive economic institutions.”4Acemoglu and Robinson, Why Nations Fail. Inclusive economic institutions encourage the participation of a large part of the population in economic activities, making use of their best skills and reaping the fruit of their efforts. Thus, inclusive institutions imply the security of private property, an impartial legal system, and equal access to public services. Taken together, these guarantee the realization of exchanges, the establishment of contracts, and entrepreneurial activity, favoring economic performance. Extractive institutions, on the other hand, aim to extract wealth and income from one part of society in favor of another, disfavoring economic performance.
According to Acemoglu and Robinson, economic institutions are created by society, and the rules that will govern them are chosen through politics.5Acemoglu and Robinson, Why Nations Fail. Thus, political institutions—that is, the rules that define how rulers are chosen, the structure and powers of government, and the purposes for which these powers can be used—are fundamental for the configuration of economic institutions and, consequently, for a society’s degree of prosperity. In this sense, extractive political institutions tend to generate extractive economic institutions and to disadvantage economic performance. On the other hand, inclusive political institutions tend to generate inclusive economic institutions and favor economic performance.
North considers that the institutions of a society, both economic and political, tend to be a heterogeneous mixture of those that induce and those that reduce the chances of increasing productivity.6North, Institutions, Institutional Change . . . A nation’s long-term economic performance depends on the extent to which extractive or inclusive economic institutions prevail.
North argues that the incentives provided by the institutional matrix, in addition to the traditional incentives established by economic theory, conceive organizations formed to take advantage of the opportunities arising from them.7North, Institutions, Institutional Change . . . “Organizations” can mean political, economic, social, or educational bodies, and encompass people bound by a common purpose. Thus, the formation and evolution of organizations are strongly influenced by the institutional framework. However, because organizations also provide a framework for human interaction, they influence how the institutional framework evolves.
In this sense, for North, institutional change results from the interrelationship between institutions and organizations, and from the way in which people perceive and react to changes in the available opportunities. It is noteworthy that institutional change is a complex and usually incremental process, although North does not rule out the possibility of discontinuous changes (resulting, for example, from wars and revolutions). The slow and incremental nature of institutional change stems from the informal constraints that are rooted in a society.8North, Institutions, Institutional Change . . .
The relationship between freedom and economic performance: Review of the literature
The contribution of the field of New Institutional Economy—including authors such as North, Acemoglu, and Robinson—has been to provide an analytical system that integrated institutional analysis into science and economic history. The subsequent challenge was to instrumentalize this analytical system to measure the contribution of institutions to economic performance. The traditional economic approach emphasized factors such as capital accumulation, innovation, and the formation of human capital, but for neo-institutionalists it is the institutions that create incentives for people to save, use capital, innovate, and invest in the formation of human capital.
Moreover, the measurement of the contribution of institutions to economic performance, in addition to using controls related to the contribution of physical capital and human capital, involves clearly defined measures of institutional quality (i.e., how inclusive and, therefore, free are the institutions of a society) and economic performance. In this sense, Gwartney and Lawson point out that freedom indexes, such as the Fraser Institute’s Economic Freedom of the World Index9North, Institutions, Institutional Change . . . or the Atlantic Council’s Freedom Index,10Dan Negrea and Matthew Kroenig, “Do Countries Need Freedom to Achieve Prosperity? Introducing the Atlantic Council Freedom and Prosperity Indexes,” Atlantic Council, accessed February 9, 2023, https://www.atlanticcouncil.org/in-depth-research-reports/report/do-countries-need-freedom-to-achieve-prosperity. can be understood as measures of institutional quality.11James Gwartney and Robert Lawson, “The Concept and Measurement of Economic Freedom,” European Journal of Political Economy 19, no. 3 (2003), 405–430. It is noteworthy that the Atlantic Council’s Freedom Index has the advantage of measuring freedom in the political, economic, and legal spheres. Likewise, there are several approaches to measuring prosperity, but most empirical work uses measures related to the UN’s Human Development Index (HDI) or gross domestic product (GDP) per capita. The Atlantic Council’s Prosperity Index has the advantage of going beyond GDP and healthcare, encompassing factors such as the quality of the environment, the treatment of minorities, and the nation’s overall level of happiness.
Here, we present a brief review of the empirical literature on this subject: works that seek to relate freedom and some measure of prosperity. It is worth noting that, as a measure of freedom, in general, the economic freedom indexes of the Fraser Institute, the Heritage Foundation12“2022 Index of Economic Freedom,” Heritage Foundation, accessed February 15, 2023, https://indexdotnet.azurewebsites.net/index. and, to a lesser extent, Freedom House13“Freedom in the World 2022: The Global Expansion of Authoritarian Rule,” Freedom House, accessed February 15, 2023, https://freedomhouse.org/report/freedom-world/2022/global-expansion-authoritarian-rule. are used. In turn, GDP per capita is the most frequent measure of prosperity and few studies adopt measures that consider other dimensions, especially of a more subjective nature. Finally, most studies seek to measure the contribution of explanatory variables to explain the dependent variable, through regression models, often using panel data. It is worth mentioning that some studies also seek to test the Granger causal relationship14Granger causality is a statistical concept that measures whether one time series is useful in forecasting another time series. Specifically, it tests whether the past values of one time series improve the predictions of another time series. In other words, Granger causality examines the causal relationship between two time series by measuring whether the information in the past values of one series can help predict the future values of the other series. If it does, then the first time series is said to Granger-cause the second time series. It is important to note that Granger causality does not necessarily imply causality in the traditional sense of cause and effect. It only measures the statistical relationship between two variables and cannot establish a cause-and-effect relationship on its own. Further analysis is often required to establish the direction and nature of the causal relationship between two variables. between freedom and economic performance; see, for instance, the work of Heckelman,15Jac C. Heckelman, “Economic Freedom and Economic Growth: A Short-Run Causal Investigation,” Journal of Applied Economics 3, no. 1 (2000), 71–91. Vega-Gordillo and Alvarez-Arce,16Manuel Vega-Gordillo and José L. Álvarez-Arce, “Economic Growth and Freedom: A Causality Study,” Cato Journal 23, no. 2 (2003), 199–215. Verdon,17Lisa L. Verdon, “Exploring the Impact of Democratic Capital on Prosperity,” SSRN 1134623 (May 9, 2008): accessed February 15, 2023, http://dx.doi.org/10.2139/ssrn.1134623. Piątek et al.,18Dawid Piątek, Katarzyna Szarzec, and Michał Pilc, “Economic Freedom, Democracy and Economic Growth: A Causal Investigation in Transition Countries,” Post-Communist Economies 25, no. 3 (2013), 267–288. and Kocevska and Disoska.19Katerina Shapkova Kocevska and Elena Makrevska Disoska, “Human Freedom and Economic Development: A Granger Causality Analysis of Panel Data” (Paper at conference: Towards a Better Future: State and Society (October 15–16, 2021), 299–317, accessed February 15, 2023, http://hdl.handle.net/20.500.12188/23754.)
Hanke and Walters review the discussion of the relationship between economic freedom, prosperity, and equality.20Steve H. Hanke and Stephen J. K. Walters, “Economic Freedom, Prosperity, and Equality: A Survey,” Cato Journal 17, no. 2 (1997), 117–44. With regard to the relationship between economic freedom and prosperity they estimate, for the year 1996, ordinary least square models in which the natural logarithm of GDP per capita is the dependent variable and the Freedom House political and civil freedom index is one of the explanatory variables. In each model, a different indicator of economic freedom is used (e.g., indices from the Fraser Institute, Freedom House, Heritage Foundation, World Economic Forum, or indices of multiple deprivation). The study confirmed the hypothesis—that more economic and political freedom implies more prosperity. The equations created in the research successfully explained between 54 and 74 percent of the expected variability of GDP per capita among the countries analyzed, with a 99 percent confidence level.
Ayal and Karras analyzed the relationships between thirteen disaggregated components of economic freedom (from the Fraser Institute index), for fifty-eight countries for the period 1975–90.21Eliezer B. Ayal and Georgios Karras, Components of Economic Freedom and Growth: An Empirical Study,” The Journal of Developing Areas 32, no. 3 (spring 1998), 327–38. The main results indicate that components such as free trade, monetary stability, and low state interference in the economy, are fundamental to improving economic freedom, these being the elements that have a stronger relationship with economic growth.
Heckelman analyzed the causal relationship, in the sense of Granger, between economic freedom (and its components), measured by the Heritage Foundation index and the average annual growth rate for the period 1991–97 for 147 countries.22Heckelman, “Economic Freedom . . .”. The results suggest that, on average, economic growth is preceded by increased economic freedom. However, this is not the case for every component of the index: while most components do precede economic growth, the government intervention component was found to come after growth. The analysis also found no causal relationship, in the sense of Granger, between trade policy or taxation and economic growth.
Vega-Gordillo and Alvarez-Arce analyzed the relationships between economic freedom, democracy (as an indicator of political freedom), and economic growth for 100 countries, for the period 1975–95.23Vega-Gordillo and Álvarez-Arce, “Economic Growth and Freedom . . .”. Two estimation methods were used: one-stage Arellano-Bond, and the two-stage generalized moments method of the Anderson-Hsiao instrumental estimator. The results indicate that political and economic freedoms positively and significantly impact economic growth, although the impact of economic freedom is almost twice the impact of political freedom. The authors point out, however, that economic freedom tends to expand political freedom, while political freedom tends to expand economic freedom.
Verdon sought to identify the impacts of democratic capital on prosperity, measured by GDP per capita, for a group of 161 countries, through panel data and Granger causality tests.24Verdon, “Exploring the Impact of Democratic Capital . . .”. The results indicate that democracy acts indirectly, through economic freedom, to improve prosperity. The causal relationship between democracy, economic freedom, and prosperity seems to have some sort of virtuous cycle: democracy and economic freedom can lead to better institutions, more stable economies, and greater opportunities for entrepreneurship and innovation, resulting in higher levels of economic growth and prosperity.
Faria and Montesinos examined whether the Fraser Institute’s Economic Freedom of the World index could be used to predict growth in GDP per capita.25Hugo J. Faria and Hugo M. Montesinos, “Does Economic Freedom Cause Prosperity? An IV Approach,” Public Choice 141, no. 1 (October 2009), 103–27. They address the problems associated with ordinary least square models, which, in the presence of endogenous variables, do not allow for causality to be established, and produce biased and inconsistent estimates. This study aims to define the exogenous component of the Fraser Institute’s Economic Freedom index by utilizing a two-stage least squares method with instrumental variables. By employing this method, the study provides a more accurate assessment of the exogenous component of the economic freedom index. The results indicate a positive, robust, and economically significant relationship between the Fraser Institute Economic Freedom index and economic growth.
Mahmood et al. investigated the contribution of economic freedom to the long-term growth of Asian countries through panel data analysis.26Khalid Mahmood, Toseef Azid, Sharif Imran, Imran Chaudhry, and Muhammad Faridi, “Impact of Economic Freedom on Economic Growth: The Case of Some Selected SAARC Member Countries,” International Research Journal of Finance and Economics 52, no. 1 (2010), 7–16. The results for the countries analyzed (Bangladesh, India, Nepal, Pakistan, and Sri Lanka) show that GDP is positively and significantly impacted by the degree of economic freedom. Market opening and foreign direct investment are the factors that generate the most impact, as well as the existence of the free private market.
Cebula et al. explored the impact of economic freedom on real GDP per capita (real income increase) in OECD nations during the period 2002–06.27Richard J. Cebula, J. R. Clark, and Franklin G. Mixon, Jr., “The Impact of Economic Freedom on Per Capita Real GDP: A Study of OECD Nation,” Journal of Regional Analysis and Policy 43, no. 1 (2013), 34–41. For this purpose, the study used fixed effect estimates based on partial least squares. The sample consisted of twenty-nine OECD member countries. Data on economic freedom were taken from the Heritage Foundation index, unemployment and interest rate information was obtained from the OECD, and data for real per capita income were obtained from the International Monetary Fund. The results show that the greater the degree of economic freedom, the greater is the economic growth of the nation. In addition, the higher the level of economic activity, the higher the level of real GDP per capita. It is noteworthy, however, that financial freedom, freedom of work, and fiscal freedom did not show a statistically significant relationship to real per capita income in OECD countries.
Bender Filho et al. sought to measure the differences between developed and developing countries in the relationship between the degree of economic freedom and the level of economic growth, from 2000 to 2007.28Reisoli Bender Filho, Cláudia Maria Sonaglio, and Carlos Otávio Zamberlan, “Instituições, Liberdade Econômica e Crescimento: Uma Análise De Países Desenvolvidos e Em Desenvolvimento,”Pesquisa & Debate Revista do Programa de Estudos Pós-Graduados em Economia Política 24, n. 2 (44) (2013) 243–66. The sample consisted of thirty-three countries, of which twenty-two were developed and eleven in development. The Fraser Institute index was used as the measure of economic freedom. To examine the heterogeneity of countries, the classification between developed and developing countries was adopted, based on GDP per capita, using data from the International Monetary Fund. The estimates were obtained using the generalized method of moments (GMM) for panel data. The results indicate that the degree of economic freedom in the five areas analyzed has influenced economic growth. Among the results, one of the notable findings of the study was the specificity of international trade, which showed a positive relationship with economic freedom for developing countries but a negative relationship for developed countries.
Piątek et al. investigated the causal relationships between political and economic freedoms and the economic growth of countries that transitioned from communism to capitalism.29Piątek et al., “Economic Freedom . . .”. The work analyzed twenty-five post-communist countries, for the period between 1990 and 2008, using twenty indicators of political and economic freedom to estimate Granger’s causality tests. The results showed that while economic freedom has a positive impact on the economic growth of economies in transition, political freedom has a neutral impact on growth. In turn, economic growth Granger-causes changes in the political freedom of countries in transition.
Spruk and Kešeljević sought to verify the effects of institutional changes (measured by the Heritage Foundation’s Index of Economic Freedom) on subjective well-being (happiness).30Rok Spruk and Aleskandar Kešeljević, “Institutional Origins of Subjective Well-being: Estimating the Effects of Economic Freedom on National Happiness,” Journal of Happiness Studies 17, no. 2 (2016), 659–712. An exploratory data analysis was carried out, involving 138 countries, from 1996 to 2010. The happiness data were extracted from the World Bank and the Heritage Foundation’s economic freedom index. Other variables, including unemployment, income, public health, civil liberties, political and religious freedoms, crime and violence, were part of the analysis. Countries with higher economic freedom were found to have high levels of subjective well-being. However, when income, unemployment, public health, and individual freedoms are lower, the level of happiness is reduced. Finally, the work suggests that increasing economic freedom can have a negative effect on happiness in the long run.
Hussain and Haque analyzed the impact of economic freedom (measured by the Heritage Foundation index) on economic growth (measured by the annual GDP growth rate and, alternatively, by the five-year growth rate, using data from the World Development Indicators of the World Bank).31Mohammed Ershad Hussain and Mahfuzul Haque, “Impact of Economic Freedom on the Growth Rate: A Panel Data Analysis,” Economies 4, no. 2 (2016), 5. To do so, they built two sets of data panels. The first consists of a fixed effects model for a sample of 186 countries, involving the years 2013, 2014 and 2015. The second consists of a random effects model for fifty-seven countries, encompassing the period 2004–14. The authors conclude that there is robust evidence of the positive relationship between the economic freedom index and the economic growth rate. Components measuring commercial, financial, business, labor, and fiscal freedoms all show a positive impact on economic growth.
Çifçi et al. investigated the effects of economic freedom on economic growth in a sample of thirty-five OECD countries, using a panel with annual data from 1996 to 2015.32Ismail Çifçi, Ergin Uzgören, and Rabia Inci Özbek, “Effect of Economic Freedom on Economic Growth: An Application on OECD Countries,” The Empirical Economics Letters 17, no. 10 (2018), 1203–11. Their economic freedom data came from the Heritage Foundation index, and GDP per capita data from the World Bank’s World Development Indicators. The econometric methodology was divided into three steps. First, a unit root test was performed for the variables, making them stationary by applying the first differences. In the second step, the long-term relationships between the variables were found. In the third step, the long-term relationships between the variables were estimated by dynamic least squares and fully modified ordinary least squares. The results reveal that economic freedom positively affects economic growth and that a one-point increase in a country’s economic freedom index generates an increase in the expected variability of GDP per capita of between US$857.73 and US$861.41.
Attílio evaluated the relationship between economic freedom and the prosperity of countries (measured by economic growth).33Luccas Assis Attílio, “Liberdade Econômica e Crescimento (1970–2014),” Revista Brasileira de Economia 74, n. 1 (2020), 23–48. For economic growth, the study used real GDP in purchasing power parity, made available by the Penn World Table, and to evaluate economic freedom, the Fraser Institute’s economic freedom index was used. The work covers a sample of 107 countries—in Latin America, Europe, Asia, and Africa—for the years 1970–2014. Panel data with fixed effects were estimated in all regressions. Developed and developing economies are separated. The results suggest a positive relationship between the economic freedom index and economic growth. Even performing different robustness tests, controls, specifications, and alternating samples and proxies, the results remained. The results indicate that the economic freedom index is associated with a higher growth of per capita income, a higher stock of capital per worker, higher productivity, and a higher level of investment.
Al-Gasaymeh et al. investigated the dimensions of economic freedom contributing to economic growth.34Luccas Assis Attílio, “Liberdade Econômica e Crescimento (1970–2014),” Revista Brasileira de Economia 74, n. 1 (2020), 23–48. They used a sample of 13 countries in North Africa and the Middle East from 2010 to 2018, using the generalized method of moments for dynamic panel data. Economic freedom data were taken from the Heri-tage Foundation index, and annual GDP per capita data from the World Bank Development Indicators. The empirical results were consistent and revealed that all dimensions of economic freedom positively influence economic growth. The study also concluded that the greater the economic freedom, the faster the economic growth will be, increasing the quality of life of individuals.
Kocevska and Disoska examined the relationship between the Cato Institute’s Human Freedom Index and economic growth for countries and for global regions. They used Granger’s causality test for panel data, to determine the direction of the freedom/growth relationship.35Kocevska and Disoska, “Human Freedom . . .”. The results for 160 economies analyzed are in line with similar studies described throughout this section, in showing that there is a long-term causal relationship between human freedom and GDP growth per capita. In turn, economic growth does not Granger-cause human freedom. On the other hand, the regional results were more heterogeneous. The authors note the difficulty in making regional comparisons, given that regions differ greatly in terms of the number of countries and, therefore, the number of possible observations for the statistical test. In this context, causation relationships were found between human freedom and economic growth only for the East Asia and Pacific region, and partially for Europe, Central Asia, and Latin America and the Caribbean.
It is worth noting that, although there is a significant amount of work that uses measures related to GDP per capita as a dependent variable, and indicators mainly of economic freedom as an explanatory variable of interest, there are few studies that address both freedom and prosperity from a broader perspective. It is this gap that the present work seeks to fill by adopting the rates of prosperity and freedom of the Atlantic Council’s Freedom and Prosperity Indexes as analyzed variables. The next section details the methodological procedures used in this project.
Methodology
Data panel models
The methodology for analyzing the panel data follows the classic formulation explained in Wooldridge.36Jeffrey M. Wooldridge, Introductory Econometrics: A Modern Approach, 6th ed. (Boston, MA: Cengage Learning, 2015). The data structure is the combination of cross-section observations over time (time series). The advantages of the panel methodology are not only the data structure, but also that it can treat both the common and individual factors of the groupings. There are 174 countries and four years (2006, 2011, 2016, and 2021), totaling 696 observations regarding freedom and prosperity measures. In addition, the panel methodology ends up having more degrees of freedom and variability than the pooled data method.
The first attempt to explore causal relationships between freedom and prosperity using Atlantic Council indexes was based on a simple model inspired by the literature and the empirical review discussed in the previous section: “prosperity is a function of freedom, human capital, and technological progress.“

The indicators of prosperity and freedom are provided by the Atlantic Council. Human capital is measured by returns on human capital and technological progress is measured by the total productivity of the factors, both made available in version 10.0 of the Penn World Table.37Robert C. Feenstra, Robert Inklaar, and Marcel P. Timmer, “The Next Generation of the Penn World Table,” American Economic Review 105, no. 10 (October 2015), 3150–82.
This modeling is limited by data availability, not only because there are four years of observations, but because not all countries have information about human capital and factor productivity for the years 2006, 2011, 2016, and 2021. The descriptive statistics of the variables used are presented in Table 1 below.
In addition to estimating these coefficients for the set of countries, a regionalized exercise was carried out, estimating the coefficients for a model that is more simplified and more appropriate to the limitations of the number of observations. Coefficients were estimated for the Americas, South Asia, Sub-Saharan Africa, Middle East and North Africa, Europe and Central Asia, East Asia and Pacific regions according to the equation below.

In this specific case, human capital was measured by the average years of schooling, using data from the United Nations Development Program.38“Human Development Data,” United Nations Development Programme (UNDP), accessed March 3, 2023, http://hdr.undp.org/en/data. This would maximize the number of observations without missing data for countries, which would enable regional estimates. Moreover, the model is log-log, so the interpretation of the coefficients is the elasticity (e.g., “sensitivity”).
Stata 17 software was used for all estimations (general model and regionalized models).
Granger causality test in panel data
From the empirical point of view, Granger causality tests in the panel data version constitute an extension of Granger’s pioneering work,39C. W. J. Granger, “Investigating Causal Relations by Econometric Models and Cross-Spectral Methods, Econometrica 37, no. 3 (1969), 424–38. starting from the specification of a bivariate model of the following type:
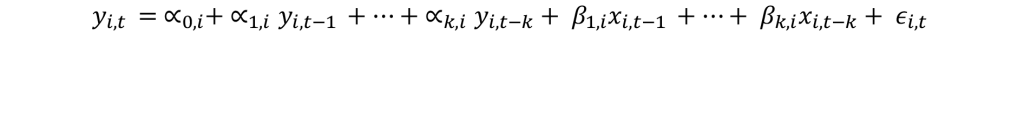
Where y and x are stationary variables, t represents the temporal dimension of the panel, and i refers to the cross-sectional dimension of the same panel.
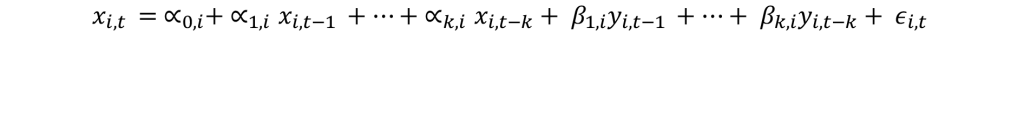
Additionally, we assume that the panel data is a large set of stacked data, with equal coefficients along all cross-sections:
Thus, the Granger causality test for panel data will be performed, which verifies the existence of temporal precedence between y and x. The null hypothesis for the test is that y does not Granger-cause x, and x does not Granger-cause y.


The test was performed for the complete data sample from 174 countries and for the regions, according to the World Bank classification: Europe and Central Asia, Latin America and Caribbean, Middle East and North Africa, North America, South Asia, East Asia and Pacific, and Sub-Saharan Africa. The software used was EViews 12.
However, to perform the Granger causality tests, a linear interpolation was performed to fill the missing data gaps for all countries (in terms of the freedom and prosperity indices) for the years 2007, 2008, 2009, 2010, 2012, 2013, 2014, 2015, 2017, 2018, 2019, and 2020. Stata 17 was used for data interpolation.
Empirical results
Estimated panel data models
Figure 1 shows the existence of a strong association between prosperity and freedom indices. The calculated correlation is 0.81. However, it is necessary to explore the existence of a causal relationship and for this reason the coefficients of the models presented in the Methodology section were estimated.
Among the panel data models there are two possibilities. The estimation of fixed effects models and the estimation of random effects models. As can be seen in Table 2, there is a substantial difference in magnitude between some coefficients for cases of fixed effects and random effects.
The estimated model had to have two binary variables (0 and 1) for the years 2011 and 2016, to capture specific effects of these years.
The resulting statistics were used to identify the type of panel model to be adopted. The result of the test was chi2(5) = 139.82, so prob > chi2 = 0.000. If this value is below 0.05, the predom-inant effect is fixed. In this case, the fixed-effect model therefore explores the relationship between the estimated variables and the results within a country. Each country has its own individual characteristics, or idiosyncrasies, that may or may not influence the estimated dependent variable. If it were a model of random effects, explains Wooldridge, it would deal with the unobserved heterogeneity, if the specific individual effects correlated with the independent variables.
Source: Authors’ own data.
Therefore, two regressions were performed assuming that the coefficients are adequately estimated by a fixed effects model (see Table 3). The first regression used the synthesis index of freedom and the second regression replaced it with its components (economic freedom, legal freedom, and political freedom).
Source: Authors’ own data.
This first exercise shows that, on the world average, the greater the degree of freedom of a country, the greater its prosperity, controlling for technical progress and human capital. This relationship, besides being positive, is statistically significant. Every one-point increase in the freedom index increases prosperity by 0.14 point. In addition, it is noted that human capital and technological progress also positively and significantly affect the prosperity of countries.
The second regression seeks to explore the components of freedom. It is perceived that legal freedom, which is related to the rule of law, is the component that affects prosperity in a more intense and statistically significant way.
Figure 2 and Table 4 show the results of regionalized grafting. As stated earlier, the estimated model is log-log type and coefficients can be interpreted as elasticities. In addition to freedom, the only variable of control that it was possible to introduce was human capital measured by years of schooling, given the limitations imposed by degrees of freedom.
Source: Authors’ own data; see Table 4.
Source: Authors’ own data.
Despite the restrictions imposed by the availability of observations, this exercise shows that the sensitivity of prosperity to freedom varies between the regions of the world. East Asia and Pacific and Europe and Central Asia do not present statistically significant freedom coefficients, while the other regions do. The largest elasticity (sensitivity) of prosperity in relation to freedom occurs in the Americas (0.503), followed by South Asia (0.375) and Middle East and North Africa (0.367) respectively—all above the world average (0.216). Sub-Saharan Africa, on the other hand, has an elasticity of 0.174, lower than the world average, although statistically significant.
Granger causality tests in panel data
The first step to perform Granger causality tests is to verify whether the series of freedom and prosperity indices are stationary, because, as in the original version, the Granger causality test assumes that the variables under study do not contain a unity root.
For the total sample and for the regions, the panel unit root test used was the Levin-Lin-Chu, which assumes common roots for all cross-sections.40Andrew Levin, Chien-Fu Lin, and Chia-Shang James Chu, “Unit Root Tests in Panel Data: Asymptotic and Finite-Sample Properties,” Journal of Econometrics 108 (2002), 1–24. The most parsimonious determinist specification and Parzen kernel estimation method were used, and lags were defined by the modified Akaike information criterion.
The results of the unit root tests point to the rejection of the existence of a stochastic trend for freedom and prosperity indexes in practically all cases, as shown in Tables 5 and 6. The only exception occurred for the freedom index in the Sub-Saharan Africa region.
Given that almost all variables are stationary, it was possible to perform Granger causality tests with data at the original level. In the case of Sub-Saharan Africa, given the existence of a unit root in the case of the freedom index, the test was performed using this variable in first difference.41In econometrics, “first difference” refers to the arithmetic difference between a variable’s current value and its previous value. It is often used to transform non-stationary time series data into stationary time series data, which is required for certain econometric techniques and models. For example, suppose we have a time series of GDP data that is non-stationary, meaning it has a trend or seasonality component that makes its statistical properties change over time. To make this data stationary, we can take the first difference of GDP by subtracting each observation from the previous observation, resulting in a new time series that shows the changes in GDP from one period to the next. The first difference transform can be written mathematically as follows: y(t) − y(t−1), where y(t) is the variable’s value at time t, and y(t−1) is its value in the previous period. The resulting time series of first differences is often used in econometric models such as ARIMA and VAR.
There is no clear rule about the number of lags that this causality test should use, and therefore, given the data limitations of the samples used, we chose to perform the test for lags that were from one to five. In the North America region, the reduced sample size did not allow more than two lags, and in the Sub-Saharan Africa region no more than four lags.
Source: Authors’ own data.
Source: Authors’ own data.
Again, tests were performed for the total sample and for the seven previous regions. The results are shown in Tables 7 and 8. In almost all cases, the results point to a bicausality, like that found by Kocevska and Disoska, between economic freedom and economic development.42Kocevska and Disoska, “Human Freedom . . .”. In other words, freedom would precede prosperity and prosperity would precede freedom, constituting a feedback effect. The exception was the North America region, where the test with two lags points to the existence of Granger causality from freedom to prosperity, but not in the opposite direction.
Final remarks
This chapter sought to analyze the empirical relations between freedom and prosperity, both in a broad sense, as measured by the Atlantic Council. This analysis is based on the neo-institutionalist approach that points out the importance of institutions that favor the exchange of property rights through the market in improving the socioeconomic performance of nations. This is because, in freer societies in which individuals can reap the rewards of their choices, there are incentives for entrepreneurial activity, capital accumulation, innovation, and investment in human capital to meet the challenges of competition. It is noteworthy that, in addition to the economic dimension, prosperity also includes respect for minorities, care for the environment, and the health and happiness of citizens, which are also more easily provided by freer societies.
To perform the empirical study, this work adopted two methodological strategies. First, a panel data analysis was performed, which estimated the coefficients of freedom over prosperity, considering control variables, such as return on human capital, schooling, and total productivity of the factors. This was the adopted procedure for all countries and for different regions of the world (using the World Bank regional classification). Secondly, Granger causality tests were performed for panel data for the total sample and for those regions.
The results of the panel data analysis are in line with the theoretical perspective and indicate that the greater the freedom, the greater the degree of nations’ prosperity. Among several components of freedom, legal freedom stands out for its statistical significance and the magnitude of its estimated coefficient. It is noteworthy that the magnitudes and statistical significance of the coefficients related to freedom differ between regions.
In turn, the results of Granger causality tests point, in almost all cases, to a bi-causal relationship between freedom and prosperity. In other words, freedom precedes prosperity and prosperity precedes freedom. This concurrency suggests an element of symbiosis between freedom and prosperity, leading to self-reinforcing cycles, both virtuous (higher levels of freedom and prosperity lead to more freedom and prosperity) and vicious (lower levels of freedom and prosperity lead to less freedom and prosperity).
It is also worth noting that these results were obtained from a short time span of data. Neo-institutionalist literature points out that institutional changes occur gradually, exerting more sensitive effects on the prosperity of a nation in longer terms. This reinforces the merits of the Atlantic Council’s initiative to develop broader indexes of freedom and prosperity and the importance of maintaining them over time. Thus, future studies can benefit from a greater temporal amplitude, producing increasingly robust results.
Vladimir Fernandes Maciel is head of the Mackenzie Center for Economic Freedom at Mackenzie Presbyterian University (Brazil).
Ulisses Monteiro Ruiz de Gamboa is a researcher at the Mackenzie Center for Economic Freedom at Mackenzie Presbyterian University (Brazil).
Paulo Rogério Scarano is head of the graduate program in economics and markets at Mackenzie Presbyterian University (Brazil).
Julian Alexienco Portillo is a researcher at the Mackenzie Center for Economic Freedom at Mackenzie Presbyterian University (Brazil).
Image: Bus driver Martin Louwrens opens shower cubicles in the wash bus, also known as "Nina Manzi" meaning "mother of water", which is South Africa's first mobile wash service providing four hot water showers and four toilets for the homeless people, a collaboration between Viva Con Agua, U-Turn and Baz-Art, currently stationed in Claremont, Cape Town, South Africa, April 26, 2023. REUTERS/Nic Bothma