China-LAC Trade: Four Scenarios in 2035
Executive Summary
Trade between China and Latin America and the Caribbean (LAC) experienced dramatic growth since the early 2000s. Going forward, China is poised to solidify its position as a leading regional trading partner.
By 2035, trade values will likely reach unprecedented levels. This, accompanied by greater Chinese investment and financial flows, will further increase China’s economic importance for LAC countries, with potential implications for prosperity and geopolitics in the region and beyond. In addition, the composition of LAC exports to China is likely to differ from today’s. Regional governments and businesses must think and plan ahead.
To provide greater insight into future commercial scenarios, “China-LAC Trade 2035” aims to trigger policy discussions and influence actions based on how this growing relationship may evolve. Drawing on economic modeling developed by the Pardee Center for International Futures at the University of Denver, as well as varied assumptions regarding economic growth and trade relations, this report outlines four scenarios for China-LAC trade through 2035.1Pardee: https://pardee.du.edu
- Scenario 1, Current Path: Despite China’s rise, the United States will remain LAC’s top trading partner through 2035. This will occur even though, from 2021 to 2035, LAC-China trade is expected to increase 1.8 times the expansion rate of global trade, reaching more than $700 billion (more than doubling 2020 figures).
- Scenario 2, Partners in Flux: By 2035, China will have overtaken the United States as LAC’s main trade partner in goods. The development will result in a historically low degree of LAC trade dependence on the United States. In 2020, LAC was about three times more dependent on the United States for exports than on China. By 2035, the United States trails behind China by 1.2 percent. China will represent more than 40 percent of exports from Brazil, Chile, and Peru.
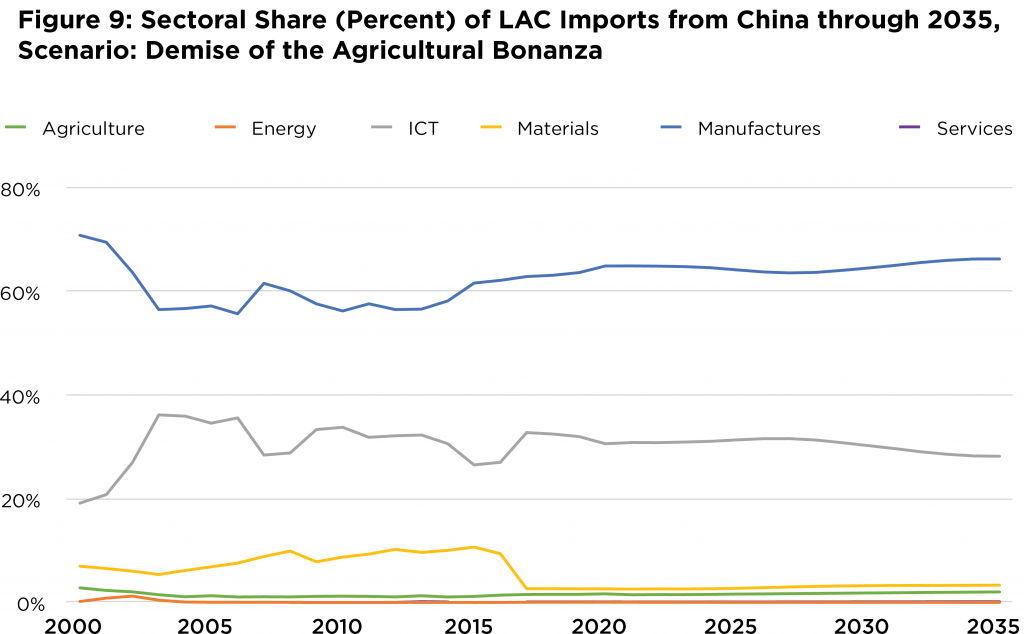
- Scenario 3, Demise of the Agricultural Bonanza: The sectoral composition of LAC exports to China changes over the next fifteen years; in particular, a steady decline is seen in the share of agricultural shipments. This scenario has major implications for governments and companies, because agricultural products accounted for around one-third of LAC exports to China in 2020. In parallel, LAC-China materials trade—such as metal and mineral commodities—will continue to rise, but at a slower pace. In 2035, China could represent 45 percent of total LAC materials exports, compared to 3 percent in 2000.
- Scenario 4, Balancing Act: An unprecedented level of mutual trade dependence emerges between China and LAC, largely driven by growing LAC imports from China. By 2035, a larger number of LAC countries would have China—instead of the United States—as their top import partner. Further, this scenario also points to historically high trade deficits for LAC in its relations with China, a thorny issue that might spark policy debates.
This report acknowledges the sharp differences across LAC countries. While the objective is to consider the region as a whole, it highlights Brazil and Mexico as case studies of regional heterogeneity. Brazil may enter a challenging moment in its trade relations with China as agricultural exports lose relative importance. This, along with a rise in Chinese imports, is expected to cause Brazil’s current trade surplus to shrink. For Mexico, the report reveals that the United States is expected to preserve—and even increase—its share of the country’s imports, bucking broader regional trends. In addition, by 2035, Mexico is likely to also make progress in the diversification of its export destinations through China and other markets.
Ultimately, when analyzing the likely contours of LAC trade in 2035, what emerges is that China and the United States will probably account for similar shares of the region’s overall trade, but with important distinctions across LAC countries. It also becomes clear that the sectoral composition of LAC exports to China is likely to change considerably over the next fifteen years, with significant implications for several countries. Across the different scenarios, China’s participation in LAC overall trade range from 15 to 24 percent, up from less than 2 percent in 2000.
In light of these potential developments, this report offers stakeholders in LAC, China, the United States, and elsewhere elements to explore different future scenarios and proactively contemplate the “what ifs” of China-LAC trade relations. By planning ahead, they will be in a better position to navigate these uncertainties now and in the future.
Snippet Preview
I. Introduction
The rise of China as an economic superpower has profound implications across the globe—and it is no different for Latin America and the Caribbean. Over the past twenty years, the region has strengthened its relations with China in the domains of trade, investment, and finance. The dramatic increase in China-LAC trade has drawn the attention of stakeholders in China, LAC, and elsewhere.
While a great amount has been written about the historic evolution of China-LAC trade, this report takes a forward-looking perspective to the issue. The COVID-19 pandemic has cruelly shown the importance of thinking ahead and preparing for alternative futures. As the world struggles to recover from the worst health and economic crisis in nearly a century, most governments and businesses are preoccupied—and rightly so—with the immediate and pressing challenges in front of them, one of which is trade. The pandemic has taken a toll on international commerce, causing the deepest contraction in world trade since the global financial crisis. As of early 2021, the road ahead for global recovery remains uncertain, and likely uneven.
What will China-LAC trade look like in 2035? How important will China be for LAC exports and imports? How will the sectoral composition of China-LAC trade evolve in fifteen years’ time? Is China poised to overtake the United States as LAC’s top trade partner? If so, under what circumstances could that happen, and what does it mean for regional and US stakeholders?
This report aims to unpack these and other questions through four plausible scenarios of China-LAC trade in 2035 (see Box 1). Operationalizing these scenarios within an integrated assessment model provides greater analytical breadth and depth. On one hand, the scenarios reveal surprising developments and analytical blind spots in trade analysis. On the other hand, they naturally enable readers to explore issues beyond trade itself, such as broader contexts underlying trade outcomes and the economic or geopolitical implications of trade for different stakeholders. The three main analytical angles adopted by this trade report (the evolution of import and export partners, sectoral composition of trade, and trade balance) also lend themselves to this type of broader analysis.
An important added value of said model is that it considers the future of global trade not just between countries, but also integrated with other economic, human, and environmental systems.
Even if in a simplified manner, the scenarios capture and estimate the effects of government actions; for example, a decision to increase or reduce tariffs, to introduce or eliminate non-tariff barriers, to prioritize single markets or explore alternative export destinations, etc. Furthermore, they illustrate the ways in which concrete trade policy choices in LAC-China trade may be influenced by, or contribute to, economic and development objectives.
The purpose of the report is not to predict the future. Rather, it is designed to provide a forward-looking analytical tool for governments, businesses, academia, and other stakeholders, thus generating a solid, quantitative basis for action-oriented discussions about emerging trends, opportunities, and risks related to China-LAC trade over the next fifteen years.
This report is structured as follows. Part 2 contains a snapshot of current China-LAC trade relations, presenting their developments over the past twenty years. Part 3 explores four alternative scenarios of China-LAC trade out to 2035, highlighting the most interesting outcomes and implications. Part 4 synthesizes key takeaways of the analysis.
Much of the report aggregates LAC as a group to provide a bird’s-eye view of the region’s trade relations with China. But, it acknowledges and addresses the distinctive country-specific dynamics where needed, and includes vignettes focusing on Mexico and Brazil to highlight the subregional differences. The time horizon adopted in this report is 2035—a timeframe still adequate for the high level of uncertainty normally associated with forecasting trade patterns. Moreover, within that timeframe, China is expected to become the world’s largest economy, a symbolic development, but one indicative of the shifting global economic landscape.
The report draws heavily on the work of the Pardee Center for International Futures at the University of Denver. The Pardee Center deployed its International Futures model to develop different estimates and scenarios for China-LAC trade in 2035, which served as the basis for this report.2Hughes, B.B. (2019) International Futures: Building and Using Global Models. Academic Press (Elsevier Ltd) An important added value of said model is that it considers the future of global trade not just between countries, but also integrated with other economic, human, and environmental systems. As a result, while much of the existing China-LAC scholarship tends to be conducted in a bilateral, and therefore siloed, fashion, this report brings an important global perspective and context to the discussion. For instance: How does LAC stack against global competitors for the Chinese market? How will US and Chinese participation evolve in LAC trade?
Box 1: Scenario Highlights through the Three Analytical Angles
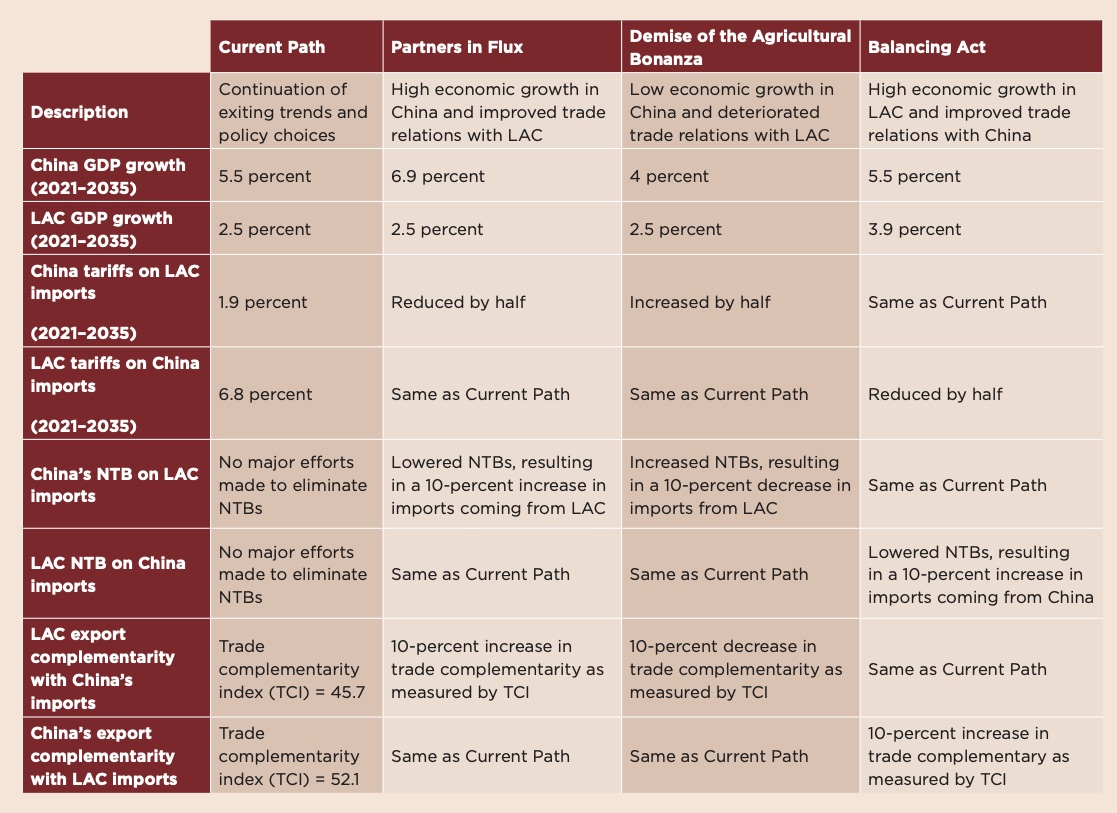
The report contains four scenarios for China-LAC trade relations in 2035, resulting from different parameters for the following assumptions: gross domestic product (GDP) growth, tariff and non-tariff barriers, and trade complementarity between what one side imports and the other one exports (for more, see Box 2 and Appendix). The scenarios highlight salient outcomes regarding the changing patterns of trade partners, sector composition, and balance between China and LAC.
Current Path (Scenario 1) is the base-case scenario. It represents a future described by a continuation of the same trends and policy choices over the past few decades. The project team adopted a best-guess GDP growth assumption for both sides, and kept current levels of trade complementarity and barriers unchanged. This scenario serves as a reference point for the alternative futures described in this study.
The report takes a closer look at how China is likely to evolve as a trade partner for LAC, and vice versa. Consequently, it also examines how other players in LAC trade are affected. Partners in Flux (Scenario 2) reveals a result worth exploring: China overtakes the United States as LAC’s main goods trade partner by 2035. Of the four selected scenarios, this outcome only happens here.
The modeling exercise also allowed the project team to explore the sectoral composition of LAC-China trade by 2035. Demise of the Agricultural Bonanza (Scenario 3) offers a good entry point to that discussion. It reveals, more than any other scenario, a significant insight: the steady decline in agriculture as a share of LAC exports to China over the next fifteen years. In 2020, agriculture accounted for 35 percent of LAC shipments to China. Under the circumstances envisaged in this scenario, that share drops to 17 percent in around fifteen years.
Trade balance is another angle explored in this trade analysis. Therefore, this report assesses how the region and different countries across LAC could have their trade surpluses or deficits affected by the evolving dynamics of China-LAC trade. Balancing Act (Scenario 4) offers an interesting window into that analysis. While China-LAC trade has been broadly balanced over the past twenty years, what emerges most markedly in Scenario 4 is a rising trade deficit for LAC in its trade relations with China. In this scenario, the report takes a closer look into the reasons why.
II. China-LAC Trade Today
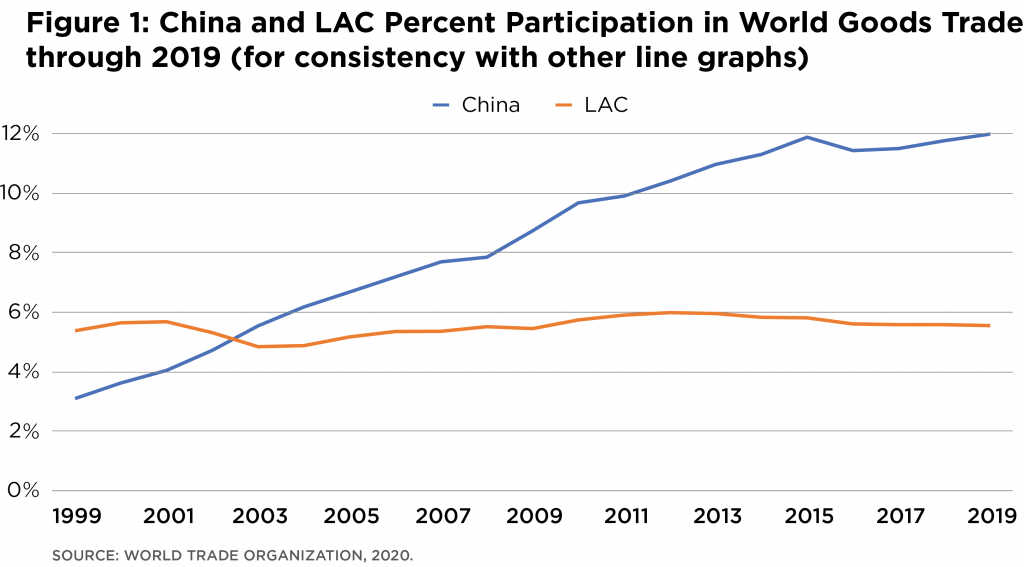
Over the past twenty years, China has emerged as a major global trading power (Figure 1). In 1999, China ranked just above Belgium, in ninth place, in a list of the world’s top exporters, and it accounted for 3.4 percent of global exports.3“World Trade in 1999–Overview,” World Trade Organization, 1999, https://www.wto.org/english/res_e/statis_e/wt_overview_e.htm At the time, the country still kept relatively high tariffs and various administrative controls over its foreign-trade regime.
China adopted several reforms when joining the WTO in 2001, bringing down its average tariff rate from 14.6 percent to 6.1 percent in the next five years.4S. M. Shafaeddin, “Some Implications of Accession to WTO for China’s Economy,” International Journal of Development Issues 1, 2, 2002, 93–128, https://unctad.org/system/files/official-document/osgrs80_en.pdf Additionally, Chinese products and services started to benefit from more favorable and predictable conditions in foreign markets. Combined with other important internal reforms, China’s WTO accession fueled the country’s rise to the ranks of a trade superpower.
Fast forward to present times, and China is the world’s top trading nation. It is the largest exporter and ranks second, after the United States, as the largest importer.5“World Trade Statistical Review 2020,” World Trade Organization, 2020, https:// www.wto.org/english/res_e/statis_e/wts2020_e/wts2020chapter06_e.pdf China accounted for 13.2 percent of global exports—and, for example, for 41.8 percent of the world’s exports of computers and 34.4 percent of TV sets in 2019.“6Trade Flow Dataset,” United States International Trade Commission, HS Subchapter 8517 and Subchapter 8528 China’s imports are large and diversified, ranging from semiconductors, machinery, and equipment to raw materials and agricultural products. As its trade relations grew dramatically, China began to feature as a key trade partner for most countries across the globe, including LAC.
In comparison, LAC participation in global trade remained stable over the past twenty years (Figure 1). The region accounted for 5.4 percent of world trade in 1999 and 5.5 percent in 2019. Mexico was, and remains, the only LAC country to feature in the rankings of the world’s top twenty importers and top twenty exporters.7“World Trade Statistical Review 2020
However, behind the appearance of stability, some significant changes have taken place. The growing importance of China is perhaps the most remarkable development in LAC trade over the past two decades. Both as a source of imports and destination of exports, China has moved from an almost negligible position to become the region’s second trade partner. As a consequence, traditional LAC partners have lost their share in the region’s trade. Mainly the United States, but also the European Union (EU) and some LAC countries, including Brazil, have experienced declining participation in LAC trade.8Calculation based on ITC data, www.intracen.org
Considering goods trade only, China displaced the United States to become Brazil’s top trading partner in 2009, a position China continues to hold. While Brazil still holds the place of Argentina’s main trade partner, China almost took the lead briefly in 2020. In addition, China was the top source of imports for Brazil, Chile, and Peru in 2019, and ranked second for another eleven LAC countries.9“UN Comtrade Database,” UN Comtrade, https://comtrade.un.org/
By contrast, LAC countries do not feature prominently among China’s destination markets. Mexico and Brazil— China’s main export markets in LAC—were the only ones representing more than 1 percent of China’s exports in 2019, with Chile, Colombia, and Peru following suit.10Calculation based on ITC data Looking at Chinese imports, Brazil featured among China’s top ten suppliers in 2019, and the other LAC countries accounted for around 1 percent or less of total Chinese imports.11Calculation based on ITC data
Figure 1: China and LAC Percent Participation in World Goods Trade through 2019 (for consistency with other line graphs)
Even amid these asymmetries, China-LAC trade flows are relatively well balanced. Over the past two decades, trade surpluses or deficits have been relatively small as a proportion of trade flows or GDPs. The aggregate numbers for the region, however, hide some important discrepancies. While Brazil, Chile, and Peru are among the few countries in the world to run a trade surplus with China, other LAC countries—such as Mexico, Panama, and Colombia—have accumulated deficits in their trade relations with China for more than twenty years.12Calculation based on ITC data.
In the aggregate, LAC trade dependence on China today is not dramatic; in fact, the United States share of LAC trade is higher than China’s.13There is a great deal of dispersion across LAC economies in terms of trade dependence. China accounted for 32.3 percent of Brazil’s goods exports in 2020, a rate well above the regional average of around 15 percent. At the same time, the United States has always had an even larger share of Mexico’s exports The degree of China’s participation in LAC trade is also not exceptionally higher than the country’s share in world trade. However, it is the evolving trendline, more than the current state of play, that draws attention in many LAC countries.
Most observers express concerns with the profile of the bilateral exchanges, as LAC mainly sells commodities to China and buys manufactured goods in reciprocation. Additionally, many share the view that certain LAC countries are not only getting overdependent on China, but their exports to China would be excessively concentrated on a handful of products. Others see it differently: the low participation of manufactured goods in LAC exports to China is primarily a function of the region’s long-standing productive structure and competitiveness issues. According to that logic, the existing “complementarity” between China and LAC—or, more precisely, South America—should be seen as neither a problem nor a panacea for the bilateral relationship itself, but as a reflection of broader underlying causes.
Relatedly, a prevalent view in LAC is that in some cases, given market conditions, a certain degree of concentration is unavoidable. China accounted for almost 70 percent of the world’s imports of iron ore, and almost 60 percent of soybeans and copper imports in 2019.14Calculation based on ITC data Even if Brazil, Argentina, Paraguay, Chile, and Peru wanted to do so, it would be challenging to find alternative markets for their commodities at the moment. Needless to say, that does not exclude the importance for these countries of developing new markets down the road or deploying strategies to diversify exports, particularly by adding value to their export base.
As the rise of China brings potential opportunities and risks for LAC countries, many wonder how the LAC trade profile will look fifteen years from now—which sectors will become more important in bilateral trade, how dependent on China LAC trade will become, and how other countries will be impacted by the developments in China-LAC trade. This report looks into these questions next, by exploring four potential scenarios out to 2035.
III. China-LAC Trade in 2035
Economic growth and trade relations are two of the most important determinants of trade flows between China and LAC. By exploring the evolution and interplay between these two factors (see Box 2 and Appendix), the University of Denver’s International Futures model generated a base-case scenario (assuming continuation of current trends) and eight alternative scenarios for China-LAC trade in 2035.
The eight scenarios were then examined through three lenses (trade partners, sectoral composition of trade, and trade balance), which are three of the most commonly used angles for trade analysis. In this process, three scenarios stood out as being particularly informative from a policy perspective, because of the salient insights and outcomes emerging around at least one of the three trade angles. Along with the base-case scenario (for comparison), they make up the four scenarios covered in this report:
- Scenario 1: Current Path (base-case scenario);
- Scenario 2: Partners in Flux (focusing on the evolution of trade partners);
- Scenario 3: Demise of the Agricultural Bonanza (focusing on the sectoral composition of trade); and
- Scenario 4: Balancing Act (focusing on trade balance).
Together, the four scenarios—looking back from year 2035—provide a possible view into the future and policy options available today. By combining quantitative and qualitative analysis into an easy-to-grasp narrative, they offer readers a useful tool to explore trade and related non-trade issues in China-LAC relations, their underlying drivers and contexts, and their resulting policy, economic, and geopolitical implications.
A fuller description of this process and methodology is included below and in Appendix.
Box 2: Scenario Assumptions
The assumptions used to differentiate the scenarios include the following:
1) Growth: High and low growth trajectories of China and LAC.
2) Trade Relations: Stronger and weaker trade relations between China and LAC, which are measured by
– Tariff rates: China (LAC) reduces (increases) tariffs on LAC (Chinese) imports;
– Non-tariff barriers (NTBs): China (LAC) reduces (increases) NTBs impeding LAC (Chinese) imports; for example, sanitary requirements affecting imports of foodstuff or licensing procedures, creating bureaucratic obstacles to the import of certain products;
– Trade complementarity (as per the World Bank’s Trade Complementarity Index (TCI): LAC (China’s) exports are more (less) aligned with China’s (LAC) imports;
These assumptions are then used to construct the following four scenarios:
Scenario 1
CURRENT PATH
2035: Looking Back
Key Takeaways
- China-LAC trade continued to rise, doubling by 2035 and reaching an unprecedented $700-billion mark. But, the United States remains LAC’s top trade partner.
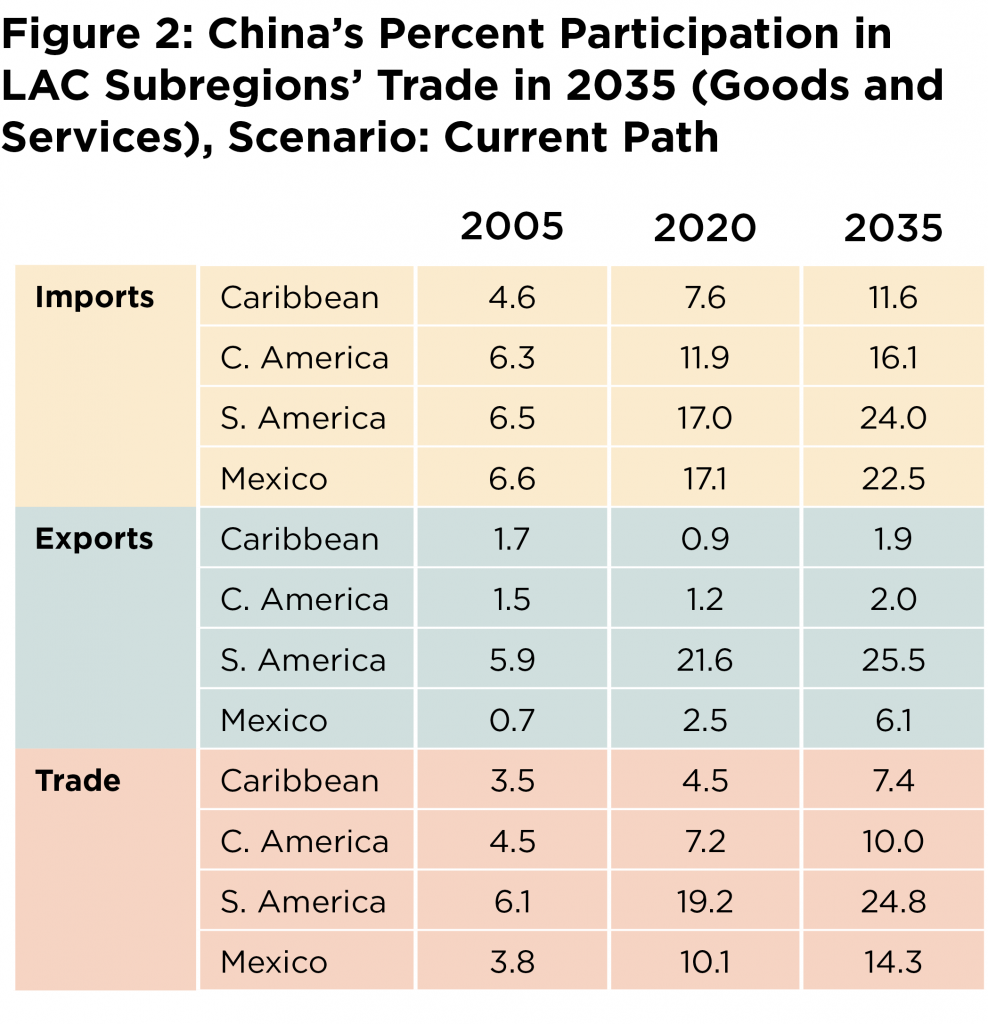
- China gained importance as both an export and an import partner for all LAC subregions, though to varying degrees. Example: China represented 25 percent of South America’s trade, versus only 7 percent in the Caribbean.
- Challenges remain for LAC to diversify and add value to its exports to China, reflecting long-standing problems related to competitiveness and productivity in the region.
- Growing awareness across LAC on the need to invest in developing new market opportunities in China.
Setting the Scene
Following COVID-19 disruptions, the global economy recovered in an uneven manner, accelerating China’s rise as the world’s largest economy. By 2035, already in top position for a few years, China accounted for nearly a quarter of the world’s GDP (23 percent). Between 2021 and 2035, its economic expansion was mostly driven by capital investment and productivity enhancements.
In this period, China enjoyed an average annual growth rate of 5.5 percent, which led to a doubling of GDP, consumption, and trade by the mid-2030s. These achievements took place despite the strong demographic headwind, which culminated in a new era of negative population growth. With 15 percent of global trade, China was also the biggest trading power by 2035 and has held that position for some time now. Three quarters of countries traded more with China than with the United States, up from just over half in 2019.
LAC economies grew at an average 2.5 percent per year between 2021 and 2035, which is lower than the global average of 2.9 percent, though higher than the previous ten-year regional average. LAC trade growth also remained sluggish, with the region’s share in world export and imports at around 5 percent. Unable to break what became a long cycle of economic underperformance, LAC reached 2035 with the lowest share of global GDP and the lowest participation in global trade since the 1970s. While some countries managed to make steady progress, LAC as a region remained unable to perform to its full potential.
Zooming out to the global trade landscape, Asia is the bright spot. World exports grew more than 40 percent from 2021 to 2035. The region accounted for more than 60 percent of the increase over this period, with Europe and North America contributing around 15 and 12 percent, respectively. Africa accounted for nearly 5.5 percent of the increase and LAC, with just over 4 percent.
Manufacturing trade was responsible for more than 50 percent of the increase in trade over this period, as services and information and communications technology (ICT) each contributed less than 20 percent. Global exports as a percent of GDP, which had grown significantly since the mid-1980s, hit a ceiling after the 2008–2009 recession and remained below 30 percent since.
New dynamics have emerged in the global agricultural trade. Africa became one of the world’s top agricultural importers, driven by population growth. After surpassing North America and LAC in the mid-2000s, China in the mid-2020s, and Europe in the mid-2030s, the continent is now second only to Asia in extra-regional agricultural imports.
Overall, as green energy became more competitive vis-à-vis fossil fuels, the energy trade began to shrink in importance relative to other segments of the economy. This was replaced, in part, by an increase in trade of ICT, whose export and import center of gravity had shifted toward China and other Asian economies, as well as materials trade, whose trade patterns remained relatively familiar, except that China has become an increasingly important destination.
China-LAC Trade in 2035
LAC countries’ booming trade relations with China stand out in marked contrast to the region’s low economic dynamism. Between 2001 and 2035, China-LAC trade grew at an impressive 12 percent annually, though most of this growth occurred prior to 2020. This expansion was more than two and a half times more rapid than growth in all LAC trade or that of global trade—both of which were around 4.5 percent. In particular, China’s commodities boom in the 2000s played a major role in rising LAC export volumes. It also had a significant effect on prices, which secured higher earnings for the region.
Specifically, from 2021 to 2035, LAC-China trade increased by 1.8 times—above the 1.4-time expansion of global trade. In 2035, trade flows between LAC and China reached more than $700 billion, an unprecedented mark doubling 2020 figures. LAC ran a trade deficit with China of 1.5 percent of its GDP, compared to 1 percent in 2020.
Behind the aggregate trade figures related to China, considerable differences exist across LAC countries and subregions. What stands out is that shipments to China were significantly more important for South America than for the rest of the region, especially the Caribbean and Central America (Figure 2). For Mexico, which is LAC’s largest trader, China became a major source of imports and, to a lesser extent, a growing export destination.
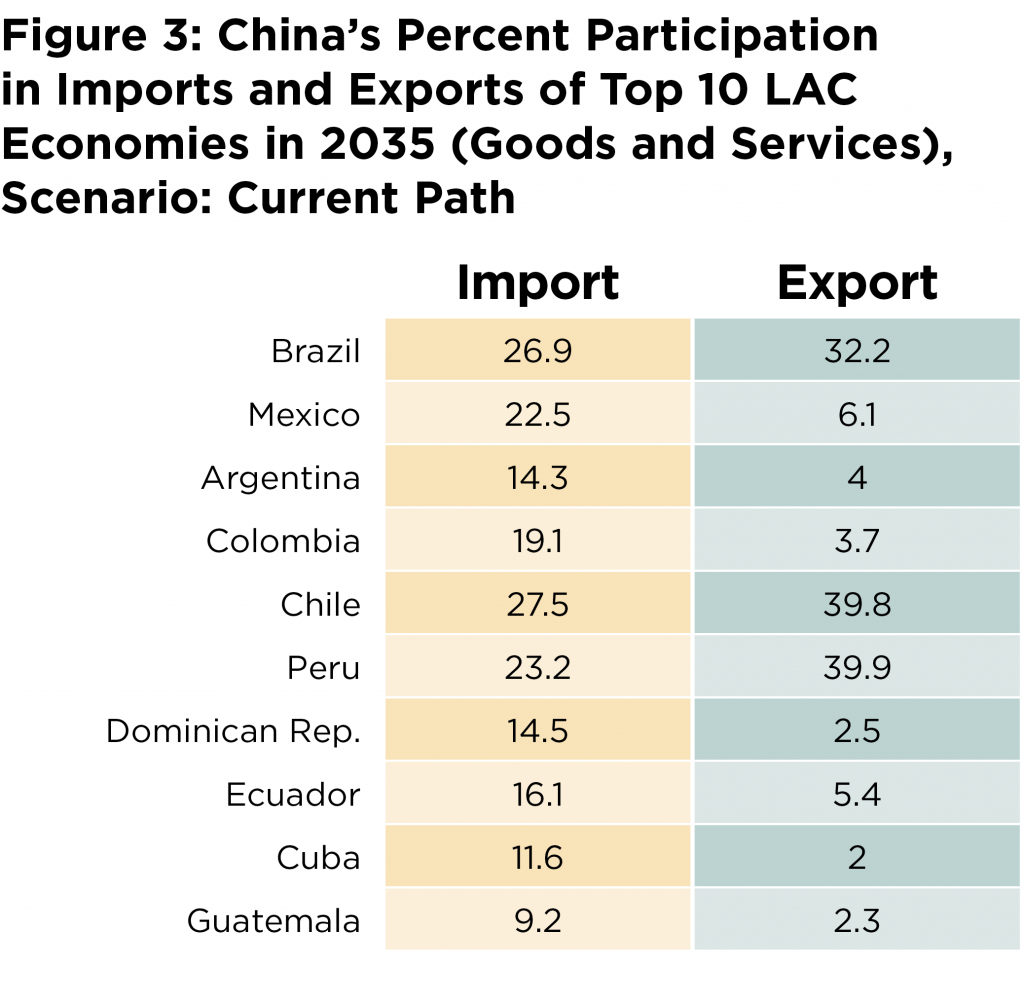
Such subregional differences appeared at the country level (Figure 3). In 2035, China is an important source of imports to all of the top ten LAC economies. But, as a market destination, it is extremely relevant to some and much less so to others.
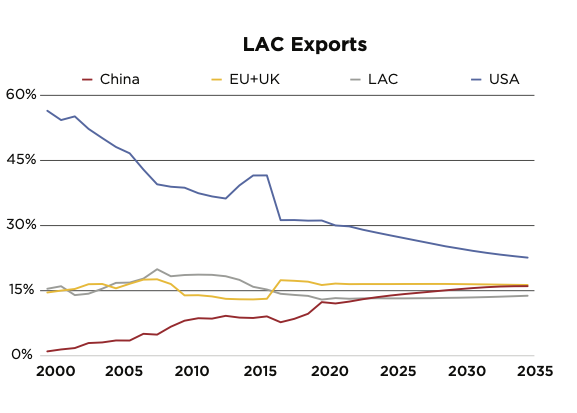
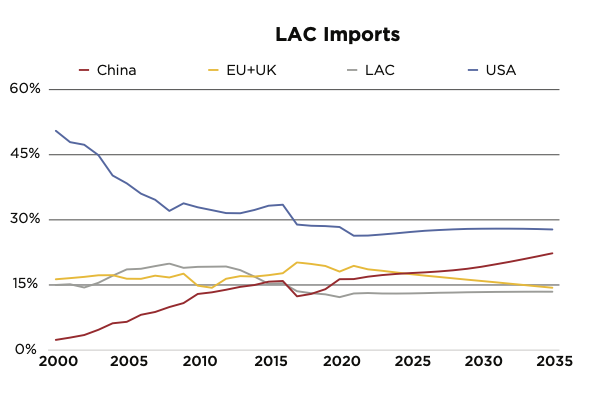
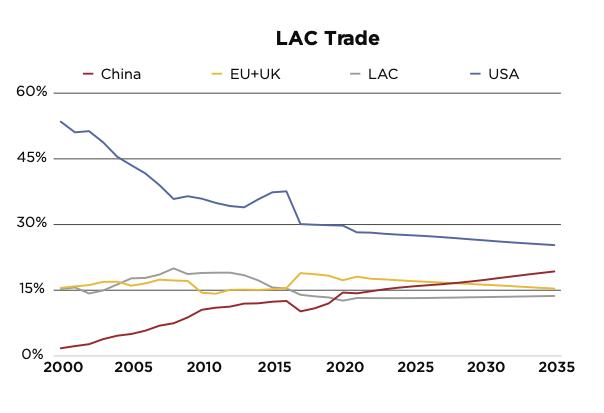
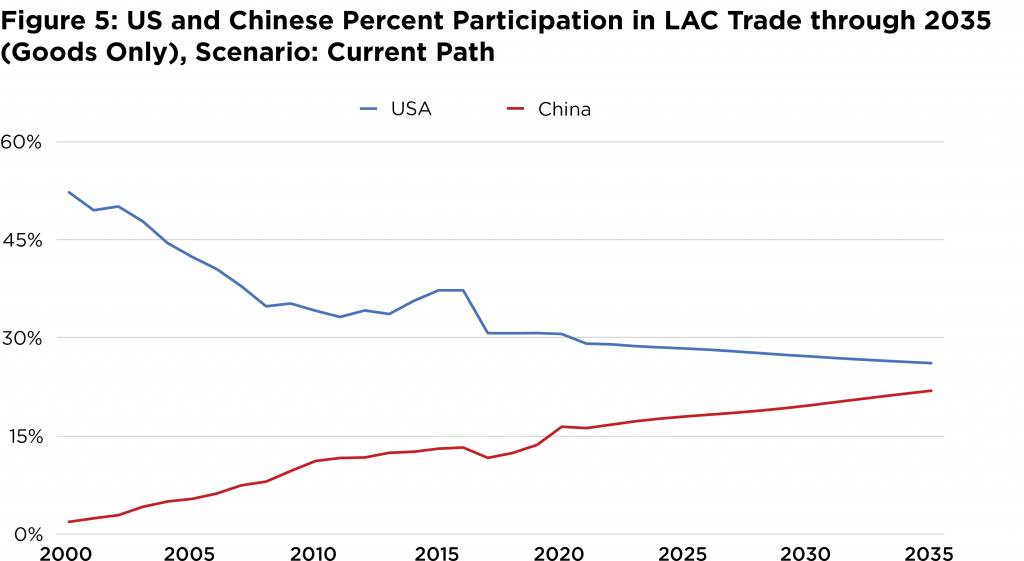
The United States has remained LAC’s top trade partner, despite a steady decline in participation since before the turn of the century. In early 2000s, more than 50 percent of the region’s trade was with its northern neighbor (Figure 4). From 2000 to 2019, China rose as a key partner for LAC. LAC trade dependence on China grew sevenfold in this period, and by 2035 it had increased by an additional 60 percent to constitute nearly 20 percent of total LAC trade. When only trade in goods is considered, the US-China competition for participation in LAC trade is even more evident (Figure 5).
In addition to the United States and China, the European Union (EU), together with the United Kingdom (UK), continued to play an important role as an LAC export partner, with slightly less participation in the region’s exports than China. The EU and the UK, nevertheless, lost participation in LAC imports.
Figure 4: LAC Export Partners, Import Partners, and Trade Partners through 2035 (Percent Participation, Goods and Services), Scenario: Current Path15 Values between 2015 and 2020 and future projections in this report may be sensitive to issues related to missing data and misreporting.
Underlying causes of trade concentration
Some believe that the low participation of manufactured goods in LAC exports to China is primarily a function of the region’s long-standing productive structure and competitiveness issues – neither a problem nor a panacea for the bilateral relationship but a reflection of broader underlying causes.
LAC intraregional trade stood at 14 percent by 2035, below its peak of 20 percent before 2020. While in other parts of the world, particularly Asia, intraregional trade expanded faster than global trade, intra-LAC trade did not show the same dynamism, and stayed relatively flat over the past fifteen years. In the absence of a major new impetus for regional integration, significant reduction of intra-LAC trade costs or major productivity gains, LAC remained unable to further develop its value chains and benefit from the regional market.
Persistent Challenges for Export Diversification in LAC:
Over the past fifteen years, LAC continued to face the challenge of diversifying its exports to China. While some progress was made in adding semi-processed products and low-value manufactured goods in LAC’s export basket to China, it is clear that additional and sustained efforts were needed. To ensure that more companies and products benefit from the Chinese market, LAC countries still face the challenge of increasing productivity and overall economic competitiveness.
LAC governments and businesses doubled down on efforts to develop market opportunities in China, including in new segments and in the country’s second- and third-tier cities, which had been largely understudied. Over this period, the number of LAC companies willing to venture into Asia and into China increased year after year. Business associations realized the need to invest in having a physical presence in China to develop long-term relationships with local partners, and to better advise their members on policy and regulatory developments, as well as market trends in China. Although still large, the knowledge gap that separates LAC businesses from opportunities in China is shrinking.
E-commerce provided a mechanism for a growing number of small and medium-sized LAC companies to export to China. Even if export values were not significant in light of total LAC shipments, for many it offered a first exposure to China’s consumers and its digital marketplace.
Last, sustainability emerged as a cross-cutting issue in China- LAC relations, which affected trade. China’s carbon emissions peaked around 2030. Since then, the country is striving to become carbon neutral by 2060. Over the past fifteen years, China grew more interested in the environmental impact of its imported products. Aware of changing attitudes abroad, major agribusiness companies and material suppliers in LAC took actions to adapt and respond. For the smaller players, however, challenges remain.
2035 and Beyond: US-China Competition on Display:
Looking at the bigger picture, it is clear that, by 2035, the competition between the United States and China is well reflected in LAC trade. In essence, China arrived in 2035 reaching unprecedented levels of participation in LAC imports and exports.
With the continuation of previous trends, China is poised to become even more important for LAC as a trade partner. The United States retains its top place but lost ground. This scenario prompted policymakers in the United States to undertake more ambitious efforts towards hemispheric integration. Working closer with the business community, they drew on the deep historical and cultural ties connecting the United States to LAC in an attempt to inject more dynamism to hemispheric trade relations. As LAC countries navigate relations with the world’s two superpowers, the renewed US commercial interests in the region—in part driven by competition with China—is broadly welcomed.
In 2035, trade flows between LAC and China reached more than $700 billion, an unprecedented mark doubling 2020 figures.
In addition to the US-China dynamics in LAC, it is also evident in 2035 that the region is paying a high price for not having properly addressed historical issues affecting its competitiveness. LAC exports are facing even fiercer competition at a global level.
Scenario 2
PARTNERS IN FLUX
2035: Looking Back
Key Takeaways:
- China became LAC’s main goods trade partner by 2035, overtaking the United States.
- From 2021 to 2035, China’s participation in the region’s trade more than doubled. The number of LAC countries having China as their main trading partner in goods grew from nine to twelve.
- As China became more important as an export partner for LAC, the United States lost ground (respectively, a 10 percent increase/decrease in Chinese/US share of LAC trade). While China also gained participation in LAC imports, it did not displace the United States.
- Overall, LAC trade in 2035 is considerably less concentrated in one single partner than in the past, with China and the United States each accounting for around one quarter of LAC trade.
Setting the Scene
In 2021–2022, the global economy experienced a sharp post-COVID recovery. In addition to China, high-income countries led the pack initially, thanks to speedier vaccine rollouts. But, as vaccines became more widely available and the global economy began to recover, other groups soon caught soon resumed their pre-pandemic growth trajectories. China was the only major economy to have registered positive growth in 2020, and averaged a nearly 7-percent expansion rate between 2021 and 2035. As result, it overtook the United States as the world’s largest economy by the mid-2020s and surpassed the entire EU (plus the United Kingdom) only a few years later. By 2035, the Chinese economy accounted for more than one quarter of the world’s GDP (26 percent) and was larger than the combined economies of the United States, India (now the world’s third-largest economy), and Japan.
Services now account for the largest share of the Chinese economy, but manufacturing—even more competitive with the help of 5G technologies—remains significant for the country. The Chinese tech scene blossomed in the 2020s and 2030s, and it overtook agriculture as the country’s third-largest economic sector by the late 2020s. While the country had been the world’s top ICT exporter since the early 2000s, the total added value of the sector was only around 60 percent that of the United States by 2020. In 2035, ICT production in China is nearly 50 percent larger than in the United States. Unsurprisingly, ICT products account for a fair slice of China’s exports to LAC. At the same time, China and India continue to lead the world in terms of agricultural production, but, given their significant domestic demand, Brazil and the United States remain the world’s top agricultural exporters.
LAC Trade with China and the United States
If goods are the only consideration, China became LAC’s main trade partner by 2035. If combining goods and services, China and the United States are basically at parity in 2035. This, coupled with a rise in Chinese investments in LAC, raised concerns in Washington and among other traditional LAC partners. If China was of little economic relevance for LAC at the turn of the century, today it is virtually impossible to talk about the region’s economic outlook without mentioning China. Looking back from 2035, LAC exports to China benefited from greater economic growth in the Asian partner, where demand grew even more aligned with LAC export basket.
Additionally, certain policy measures lowered trade barriers that had negatively affected LAC exports. China streamlined and simplified procedures to authorize imports of processed foodstuffs from LAC. Following bilateral understandings, physical inspections of plants were reduced (in the case of meat or fish products, for example), benefitting from practices observed during the COVID-19 pandemic, when remote verifications became prevalent. For ICT and manufactured products, technical requirements—including labeling—became more transparent. Furthermore, blockchain and big data helped to reduce information costs related to product tracking and tracing, as well as to trade logistics and transportation. China expanded existing free-trade agreements with LAC countries and signed a few others, reducing tariffs on the region’s exports.
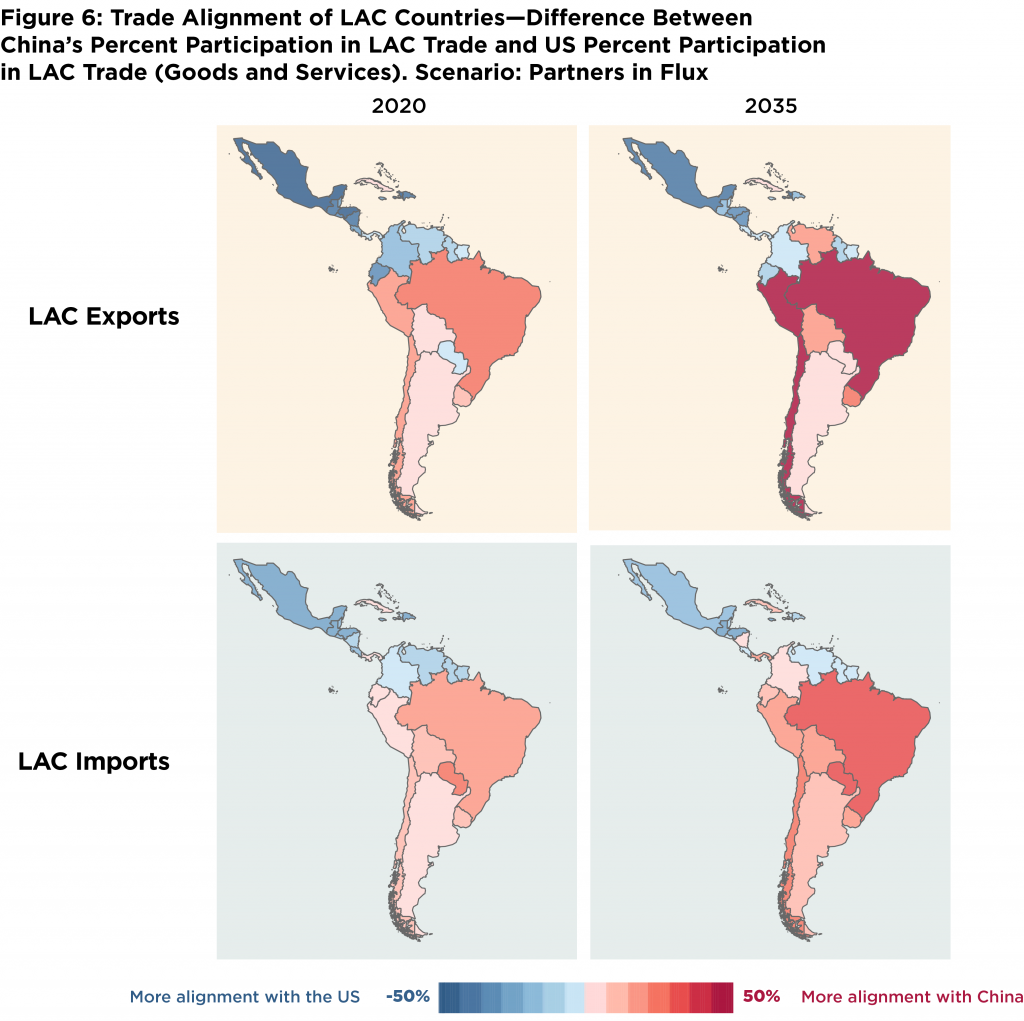
From 2021 to 2035, Chinese participation in the region’s trade more than doubled, reaching an unprecedented 24 percent. This contributed to China’s slow but steady replacement of the United States as the main trade partner of an increasing number of LAC countries. In 2035, twelve LAC countries traded more goods with China than with the United States (Figure 6), up from nine in 2020.
Beyond the headlines, disaggregating import and export statistics revealed a more nuanced story. On the export side, the increased participation of China in LAC exports was accompanied by a reduction in the relative importance of the United States as an export market. This did not happen on the imports side, where China gained shares in LAC imports but not at the expense of the US position.
Strategic value of US market
“Traditionally, the United States has absorbed a sizable share of LAC manufactured exports. Exports of industrialized goods are normally associated with higher positive spillover effects for the economy in comparison to exports of raw materials, including in terms of jobs. Irrespective of LAC relations with China, the industrial sector across LAC sees the US market as of great strategic value.”
LAC exports to China and to the United States
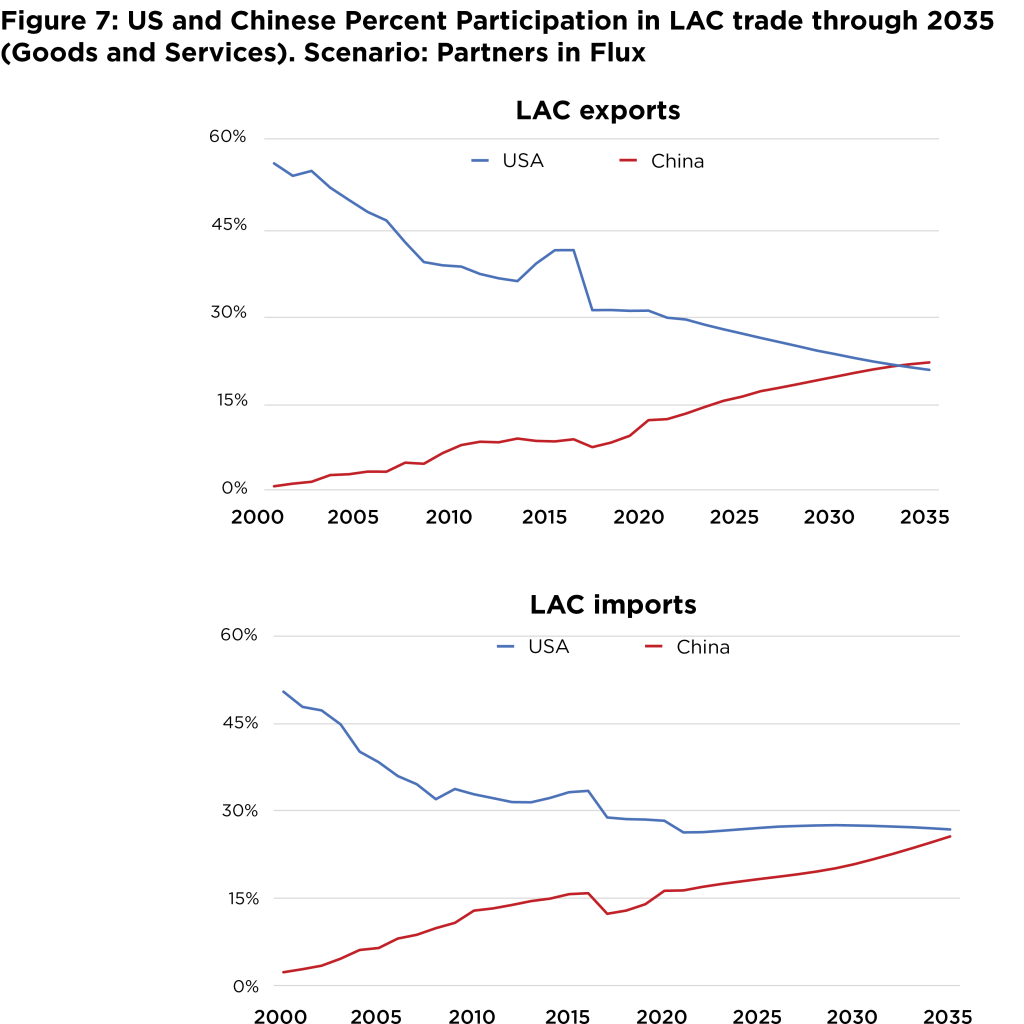
In 2000, the United States accounted for almost 60 percent of LAC exports, while China’s share was less than 1 percent. At that point, China was at the beginning of its journey toward the position of a global trade power, and its share in world imports was also small, at just 3.6 percent. By 2019, the gap between China and the United States in LAC trade was diminishing, but the United States still held a comfortable first place as the region’s top destination market: LAC was more than three times more dependent on the United States for exports than on China. However, by 2035, that difference narrowed and eventually reversed. The United States accounts for 21.1 percent of LAC exports, and China for 22.3 percent (Figure 7).
Overall, LAC continued to be a competitive supplier for products that met complementary demand in China. However, the region’s shipments remained concentrated on a few products. And, given the specific products at hand—oil, soybeans, iron ore, copper, and cellulose—they are also concentrated in the hands of relatively few companies. In 2020, around 4,100 Brazilian firms exported to China, whereas more than 28,700 imported from China. By 2035, a higher number of Brazilian companies ventured into the Chinese market, but Brazil—like other LAC countries—sees both product and firm-level diversification as a continued challenge. Relatedly, despite recent progress, there remains considerable room for LAC to add value and move up the value chain on its exports to China.
In the same period, LAC exports faced increasingly fierce competition in the United States, where imports from the region failed to retain market shares. For example, in 2021, around 18 percent of US manufactured imports came from LAC. By 2035, it dropped to approximately 15 percent.
Traditionally, the United States has absorbed a sizable share of LAC manufactured exports. Exports of industrialized goods are normally associated with higher positive spillover effects for the economy in comparison to exports of raw materials, including in terms of jobs. Irrespective of LAC relations with China, the industrial sector across LAC sees the US market as of great strategic value. As a result, policy measures to further improve economic relations with the United States remain a top priority for business entities across LAC countries with a stronger industrial base, including Mexico, Brazil, Argentina, and Colombia.
The poor performance of the region’s exports to the United States is widely perceived as a symptom of the persistent problems undermining LAC manufacturing competitiveness. In that segment, resilient and sustained LAC exports to the US market are broadly associated with intra-industry trade or long-established value chains. These connections with US buyers and partners contributed to the competitiveness and success of those LAC companies in the United States. Such connections are growing, but less common, with Chinese buyers and partners.
LAC imports from China and the United States
Compared to LAC exports, LAC imports tell a different story regarding US-China competition. While China’s share of LAC imports continued to grow, the participation of imports from the United States leveled out around 2022. The United States stopped losing market share in LAC since then, largely thanks to deeply integrated value chains in North America, and also to US exports of energy and services to Mexico and Brazil. Among LAC main import partners, it is the EU that primarily lost share amid competition from Chinese and US companies. By 2035, the EU-Mercosur trade agreement was in force, but it did not prove sufficient to secure the position of EU exports in the region as a whole. At the same time, China made significant strides. In 2019, LAC was twice as dependent on the United States for imports than on China. By 2035, China’s share in the region’s imports nearly doubled, reaching 26 percent (Figure 7 above).
LAC trade is geographically more balanced, but aggregate numbers conceal disparities
LAC trade in 2035 looks more geographically balanced than it was in 2000 or 2020. With its top two partners representing around one quarter of LAC trade each, the region’s dependence on one single market is now considerably lower than in the past. This development also highlights a dramatic shift in comparison to LAC trade distribution by partners in 2000. For the United States, this represented an unprecedented low level of participation in LAC trade.
Importantly, aggregated LAC numbers hide significant differences among countries in the region. Certain countries have grown more dependent than others on trade with China. On the one hand, for Brazil, Chile, and Peru, competitive advantages in metal and mineral commodities continued to propel exports to China, faster than to other destinations. As a result, China reached record levels of participation in the three countries’ exports (more than 40 percent). On the other hand, China accounted for between 10 and 20 percent of exports from Venezuela, Uruguay, Bolivia, and Mexico, thus consolidating itself as a key destination, but not a dominant one. Meanwhile, on the import side, China’s increasingly competitive manufactured goods continued to gain ground across the region, though at varied paces across countries.
By 2035, China’s increased share in the region’s trade (relative to 2019) ranged from around 20 percentage points in countries like Brazil, Chile, and Peru, to less than 5 percentage points in many Central American and Caribbean economies. Argentina is the only country where China experienced a slight decline in participation, particularly in light of more dynamic growth of Argentine agricultural exports to Africa.
Within LAC, Brazil remains China’s top trade partner by a wide margin. In addition to being a large economy, Brazil has the highest trade complementarity index with China among LAC countries. Following Brazil, Mexico, Chile, and Peru come next as China’s main partners in LAC.
2035 and beyond: China as the new number one
Looking back from 2035, LAC’s geographical distribution of trade has changed considerably over the past fifteen years, but followed a trend that had begun early in the century. Having steadily gained prominence as LAC’s goods trade partner, China ultimately overtook the US position, in a symbolic development. What happened in other parts of the world is now also seen in LAC—the last bastion of US trade dominance
Scenario 3
DEMISE OF THE AGRICULTURAL BONANZA
2035: Looking Back
Key Takeaways:
- Agricultural exports had been a major driver behind growing LAC trade with China between 2000 and 2020, but declined between 2021 and 2035 (18 percent relative to other export sectors to China). The reason? Fierce competition from Chinese domestic producers and other international players, such as Indonesia and Thailand.
- Nevertheless, LAC increased its global agricultural exports by around 15 percent between 2021 and 2035 in value terms. Markets other than China (particularly Africa) helped to keep demand high.
- These developments highlighted the importance of diversifying LAC exports to China, and of developing new markets for traditional LAC exports.
- The profile of Chinese exports to LAC remained unchanged, with manufactures and ICT products together accounting for around 90 percent of total exports to the region.
Setting the Scene
With the momentum of decades of rapid economic growth, China overtook the United States in 2027 as the world’s largest economy. But, a relative deceleration in China over the more recent period meant that the transition was delayed and less clear cut, as the two economies stayed head to head for a few years. In 2035, the Chinese economy is growing at roughly the same rate as LAC, and only about 1 percentage point higher than the United States. Domestic economic challenges in China—notably the demographic pressure, combined with a less favorable international scenario—make it difficult for China to sustain high GDP growth rates. The continuous, yet decelerated, rise of China marks the current global economic outlook, with implications for commerce.
By 2035, China-LAC trade relations are not at their brightest moment, as a result of policy and economic developments. China introduced new barriers to imports from the region, which affected the few sectors that had remained competitive in the Chinese market. In addition, Chinese import needs became less aligned with segments in which LAC excels—and that is particularly striking in agriculture. Ultimately, the slower pace of China’s GDP expansion meant a reduced dynamism for its imports, and not only from LAC.
Even though China’s rising presence was a clear feature of the LAC economic landscape from 2000–2035, the United States retained its position as the region’s top trade partner. Over this period, the United States managed to contain the fast speed with which China was displacing US imports in LAC. China continued to gain ground, but no longer at the expense of the United States’ dominant position.
Now, in 2035, LAC continues to produce roughly one fifth of global agricultural goods, and its agricultural exports are around 25 percent higher than in 2019. Brazil alone accounted for 13 percent of the increase in global agricultural exports between 2021 and 2035. Nevertheless, during this time, the world became slightly less dependent on LAC for agricultural imports. This was, in part, due to China’s reduced demand for imports and increased domestic production capacity, but also heightened global competition attributable to suppliers in Indonesia, India, and Thailand, among others. The changing circumstances forced LAC governments and businesses to adapt, serving as a late reminder of the importance for the region to broaden and diversify its export base.
Decline in agricultural exports to China
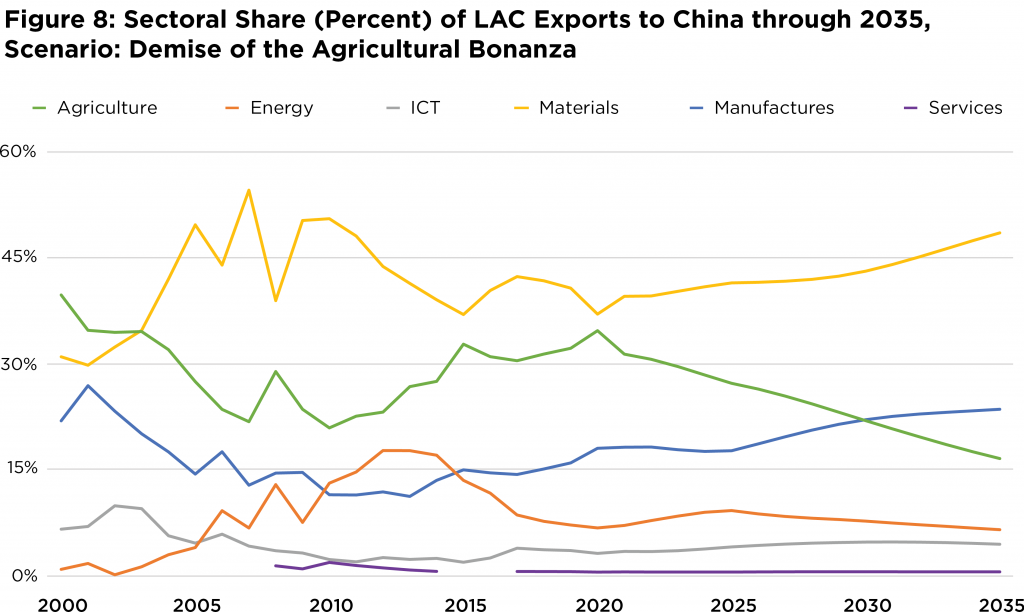
Agricultural exports from LAC to China experienced an absolute decline, reaching, in 2035, levels similar to those of 2017 and below the peak seen around 2020.16Services is one of the sectors included in the model. However, the dataset used for this modeling exercise—Comtrade services data—has no reported trade between LAC economies and China (exports or imports), except for Chile. This is likely more influenced by underreporting than by an accurate representation of zero flows. However, without a widely accepted approach to filling in missing service data, the authors have elected to treat it the same as other trade flows, namely to prioritize existing data in the initialization of bilateral trade forecasts for intra-LAC trade and LAC trade with China and the United States. This means that all LAC service trade with China (except for Chile) receives a value of zero in the initial year of the forecast, and does not grow throughout the horizon. This decision may also somewhat deflate the relative importance of China (and the United States) as a trade partner With exports rising in other segments, agriculture also suffered a relative drop in terms of sectoral relevance (Figure 8). Various factors contributed to that outcome.
First, by 2035, China’s population began to contract, and demand for food and other agricultural products was more easily met by domestic production. China’s efforts toward increased food security had repercussions on its trade with LAC. Flexible biotechnology regulations and domestic breakthroughs in that area, combined with 5G applications in agritech, played a key role in boosting agricultural productivity in China. The country saw significant technological progress in its agricultural equipment, one of the priority sectors of its “Made In China 2025” policy.
Additionally, the inability of WTO members to adopt disciplines curbing domestic agricultural subsidies left China with little constraint to increase the support provided to its farmers, which contributed to higher outputs. At the same time, this distorted markets and made it more difficult for LAC to compete in the Chinese market, for example, in cotton and corn.
Moreover, as China diversified its agricultural import partners, LAC faced greater competition from some Asian countries in the Chinese market. Indonesia, for example, accounted for nearly 7.5 percent of Chinese agricultural imports in 2035 (up from around 4 percent in 2020). Similarly, Thailand’s participation grew from around 5 percent in 2020 to 7 percent in 2035. As Asian intraregional trade was further boosted by the 2020 Regional Comprehensive Economic Partnership (RCEP) agreement, LAC felt the impact. In 2035, LAC agricultural exports to China accounted for merely 16.6 percent of the region’s total exports to its Asian partner, falling from around 35 percent earlier in the century.
In the meantime, Africa emerged as a top destination for LAC agricultural exports over the past two decades. This was a result of the decline in agricultural exports to China, but also of higher demand in Africa, given demographic pressures and challenges in supplying these products domestically. The African continent accounted for around 3 percent of overall LAC agricultural exports in 2000, 7 percent in 2020, and nearly 18 percent in 2035. Seeing the vastly untapped potential in Africa’s consumer market, many trade-promotion agencies in LAC embarked on a decisive pivot from Asia to Africa.
As agriculture lost relative importance as a share of LAC total exports to China, other segments gained room. Since 2025, there has been an increase in the participation of LAC exports of manufactured goods, including semi-processed products or lower value-added products to China.
Exports of manufactured goods also grew in absolute terms, though at a lower rate than in 2001–2015. Such developments were primarily driven by Brazil, though Mexico also contributed to the growth.
Materials and Energy
By now, China’s GDP expansion is considerably less dependent on infrastructure investment, following decades of efforts to rebalance the economy toward increased consumption. This, combined with a more moderate GDP growth, affected its demand for materials. On average, annual growth in LAC materials exports to China is now the lowest on record, though still positive. Materials, including iron ore and copper, still accounted for the lion’s share of LAC exports to China.
In 2000, China only represented 3 percent of total LAC materials exports—a share that increased dramatically to reach more than 45 percent in 2035. The Chinese appetite for minerals and metals drove up international demand and prices, providing an economic boost to South American economies, notably Brazil, Chile, and Peru. Across these countries, all marked by high systemic inequalities, discussions about the benefits of trade and its impact on income distribution picked up in recent years. Governments started to more seriously consider accompanying policies to ensure that trade delivers on its development potential.
Energy production (primarily oil) peaked in the mid- 2000s for several LAC countries, including Mexico, Venezuela, and Argentina, affecting their export revenues. From that point onward, regional production remained relatively constant until 2035—thanks to Brazil, new players such as Guyana, and, to a less extent, Colombia. Brazil further consolidated its position as a regional energy producer, accounting for one third of it in 2035, up from one quarter in 2020 and 14 percent in 2000.
Despite the steady decline in volume and value of LAC energy exports since the early 2010s, the segment preserved a stable share of the region’s exports to China from 2021 to 2035. By 2035, however, LAC’s importance for Chinese energy imports reached its lowest point (3 percent of total Chinese energy imports) since 2006, down from a peak in 2013 at 8 percent. China’s main energy suppliers in 2035 were Russia, Australia, and Saudi Arabia.
LAC manufacturing imports
Manufacturing and ICT remained dominant in LAC imports from China, representing, respectively, around 65 and 30 percent of total imports (Figure 9). Mexico, Brazil, Chile, Colombia, and Peru made up 80 percent of the region’s manufacturing imports from China. China continued to be a key supplier of machinery, equipment, and intermediate goods for LAC industrial needs. New technologies enabled by 5G infrastructure, such as Internet of Things and artificial intelligence, helped to upgrade China’s already competitive industrial base. As a result of Chinese progress in these sectors, little-known or little-valued Chinese brands in the past became popular in LAC among consumers and industrial segments. By 2035, China accounted for more than 20 percent of total LAC manufacturing imports.
With just under 30 percent of the total, the United States retained its position as the region’s main supplier of manufacturing goods. The high degree of trade integration between the United States and Mexico was a key force behind the aggregate result. Germany and Japan remained important sources of manufacturing import. And, by 2035, Brazil, India, and Mexico came next as LAC import partners in that sector.
In 2035, LAC agricultural exports to China accounted for merely 16.6 percent of the region’s total exports to its Asian partner, falling from around 35 percent earlier in the century.
An increasing number of Chinese companies have set up production facilities in Mexico. Driving this novel development is a desire to secure and improve access to the US market, in the context of continued global value chains (GVC) reconfiguration. Over the past decade, some supply chains have shifted out of China—a phenomenon propelled by higher labor costs in the Asian country, growing concerns over geographic concentration of suppliers, and US trade and investment restrictions imposed on Chinese manufacturers. Following new Chinese investments in Mexico, intra-industry and intra-company trade became more prominent in China-Mexico trade, thanks to Mexico’s privileged position vis-à-vis consumers and supply chains in the United States.
2035 and beyond: the downturn of LAC agricultural exports to China
A sectoral breakdown of China-LAC trade in 2035 shows that, while the profile of LAC imports remained largely unchanged for the past fifteen years, LAC exports to China underwent a significant sectoral shift.
Over this period, the number of LAC companies willing to venture into Asia and into China increased year after year.
The agriculture bonanza experienced around 2020 was sorely missed by several LAC countries, including Brazil, Argentina, Chile, Peru, and Uruguay. The challenge to make other export sectors more competitive in the Chinese market just became more evident for LAC. The same is true for the need to develop new, alternatives markets for traditional LAC exports, such as agriculture and, increasingly, materials.
Scenario 4
BALANCING ACT
2035: Looking Back
Key Takeaways:
- China and LAC reached unprecedented levels of mutual trade dependence, driven primarily by LAC imports from China. In 2034, for the first time ever, more LAC countries had China—instead of the United States—as their top import partner (for both goods and services).
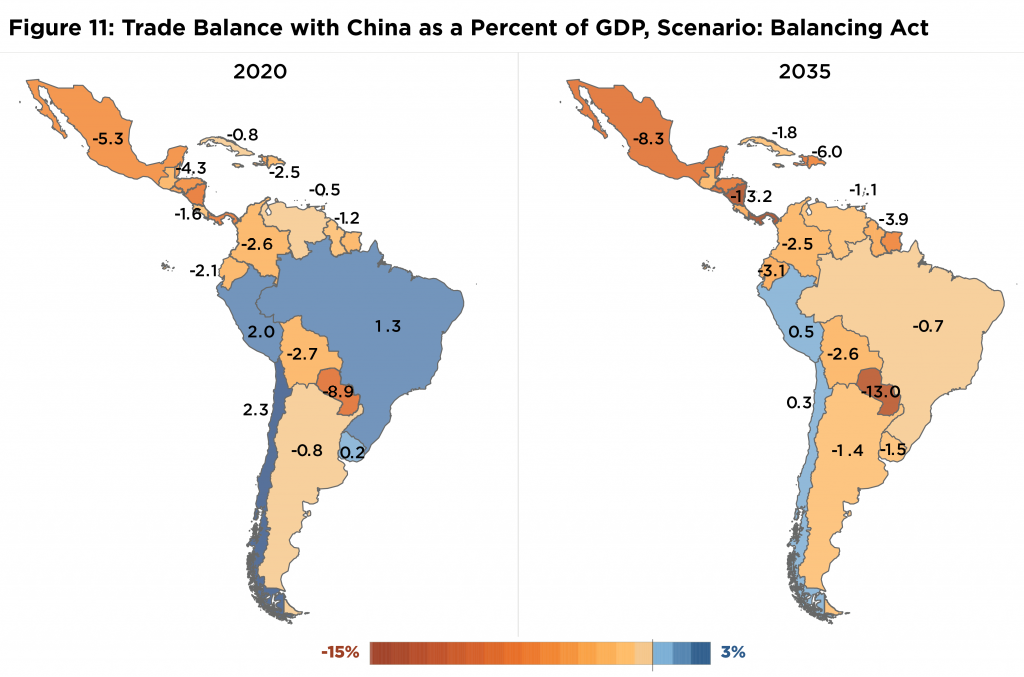
- This also impacted trade balance, causing LAC trade deficits with China to rise from 1 percent of GDP in 2020 to 3 percent in 2035. Even Brazil started running trade deficits with China. Mounting pressures on LAC industrial sectors led to calls for trade barriers against more industrialized economies.
- LAC increased, and then retained, its participation of around 8 percent in China’s total trade. While this was a record high for LAC, the share of China in LAC trade was much higher (22.5 percent).
Setting the Scene
LAC enjoyed a sustained period of economic growth, which was much needed in a region underperforming for decades. From 2021–2035, annual LAC growth averaged just under 4 percent, and by 2035, the region’s average GDP per capita (PPP) reached the levels of high-earning Mexico and Uruguay in 2019.
Over this period, LAC not only experienced political stability, but also managed to mitigate some of its enduring economic challenges, including low productivity and investment rates. Economic growth, combined with targeted social programs, helped to reduce poverty, leading to a middle-class renaissance across LAC countries. The COVID-19 pandemic, which hit LAC harder than the global average, forced countries to confront some of their structural vulnerabilities. In recovering from the crisis, LAC managed to implement some important reforms and entered a period of sustained growth.
While LAC is still one of the most unequal regions in the world, inequality and poverty continued to fall, reaching new lows in 2035. The share of the population living on less than $3.10 per day went down from 13.6 percent (88.4 million people) in 2020 to 7.3 percent (53.8 million people) in 2035. As disposable income grew, so did demand for, and consumption of, imports.
Several governments in the region took concrete steps to further integrate their countries into the global economy, by reducing trade barriers, joining free-trade agreements, and attracting foreign direct investment (FDI). In fact, the region’s optimistic outlook led to record levels of FDI inflows, reaching 5 percent of GDP by 2035. Notably, Chinese companies played a prominent role in this new wave of investments in LAC. The vast majority of LAC countries have joined the Belt and Road Initiative, which regained strength following the disruptions caused by the pandemic.
Deepening China-LAC trade ties
Between 2021 and 2035, China-LAC trade profited from positive policy and economic developments, especially in LAC. The region reduced its barriers to imports from China, which happened as a result of unilateral reforms in some countries, as well as trade agreements involving China and certain LAC partners. In addition to upgrading existing free-trade agreements and signing new ones, some LAC countries and China pursued understandings in the areas of trade facilitation, regulatory cooperation, and trade in local currencies. This contributed to a reduction in trade costs and promoted exchanges.
Trade negotiations in the Asia-Pacific region attracted the interest of countries like Chile, Peru, Colombia, and Mexico—all keen to benefit from opportunities in the world’s most dynamic region and to join Asia’s tightly run value chains. At the same time, a more robust economy in LAC favored imports of both intermediate and final goods, and China was well positioned to cater to these needs. This led China to hold a leading position among exporters to LAC.
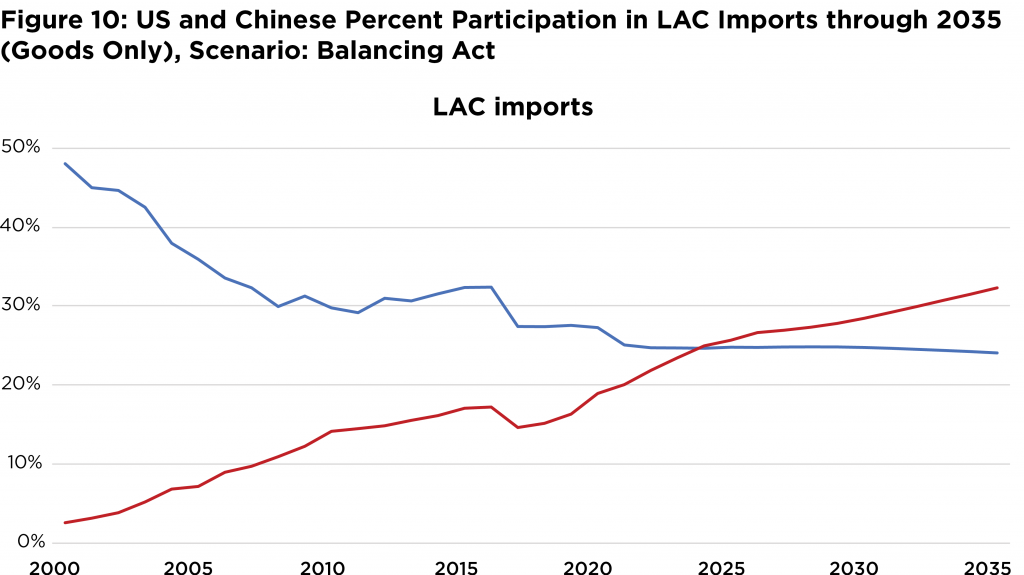
Overall, China gained participation in LAC trade, a result primarily driven by higher LAC imports from China. Around 28 percent of what LAC imported in 2035 came from the country, an unprecedented mark for China in LAC. That is considerably higher the 16.3 percent seen in 2020.
As of the early 2030s, LAC began to rely more on Chinese imports than on US imports, considering goods and services combined. For goods alone, that happened around 2025 (Figure 10). In 2034, for the first time, a higher number of LAC countries had China—instead of the United States—as their top import partner (for both goods and services). China’s relevance as an export market for LAC also increased—from 12.5 percent to around 16 percent between 2020 and 2035—a more modest rise than the one on the imports side.
Looking at the trade relations from China’s angle, what stands out between 2021–2035 is that LAC participation in China’s trade also increased compared to preceding decades. After having gained some market share in the early 2020s, LAC managed to retain these record levels of participation (around 8 percent of China’s overall trade) for around a decade.
In essence, both LAC and China have become more relevant than ever as each other’s trade partners. However, the levels of participation are different. China is a far more important trade partner for LAC than LAC is for China. The imbalance is noteworthy, as the region accounts for around 8 percent of China’s trade, while China accounts for 22.5 percent of LAC trade. Likewise, while China kept gaining participation in LAC trade, LAC was only able to sustain its increased share in China’s trade in the past years.
Trade balance, rising imports, and adjustment costs
By 2035, the circumstances described above, but particularly LAC’s higher economic growth, led to increased import demand and a higher trade deficit for the region vis-à-vis China (Figure 11). At this point, Paraguay, Nicaragua, and Panama ran, with China alone, trade deficits above 10 percent of their GDPs. Mexico and Paraguay did not fall much behind (nearly 10 percent). Even Brazil, which accumulated surpluses with China for a long period of time, began running deficits. Peru and Chile were the only countries in the region that still maintained a surplus with China and, even so, as a percent of their GDP, their surplus was considerably lower than in 2020.
Looking at trade balance from a sectoral angle, it is clear that LAC’s surplus with China in agriculture, energy, and materials combined was not enough to compensate for the region’s growing deficit in manufactured goods and also, albeit to a smaller degree, in ICT. Zooming in on LAC’s trade deficit in manufactured goods, what emerges is that Mexico, Brazil, Chile, and Peru were the countries with the highest absolute deficits in this segment. In relative terms (as a share of their GDPs), Central American countries run the largest deficits with China.
While trade specialists tend not to see trade deficits as problematic per se, some stakeholders in the region were keen to make use of the imbalance to rally anti-trade and anti-China sentiments among their respective constituencies. In particular, certain economic sectors impacted by imports also used the growing deficit with China to amplify the calls for countermeasures, including trade remedies.
Indeed, many LAC governments had struggled to implement complementary policies to mitigate the impact of trade liberalization on sectors—and workers—most affected by more competitive imports. Even more so than in the developed world, governments across the region found it challenging to implement labor-force adjustment policies, including reallocation of workers between sectors, reskilling and upskilling of affected workers, and expanding social safety nets.
On the flip side, LAC countries benefited considerably from improved access to foreign markets and from increased competition in their own domestic economies.
2035 and beyond: Unprecedented levels of trade dependence, with rising trade deficits for LAC
A key takeaway of this scenario of high growth in LAC and lower trade costs for Chinese products in the region is that China-LAC trade ties in 2035 grew deeper. Never has China accounted for so much of LAC trade and never has LAC accounted for so much of China’s trade. However, certain asymmetries remained, inviting calls for balancing acts on multiple fronts. For instance, LAC is significantly more dependent on China than vice versa; rising imports also resulted in a historically high trade deficit with China for the LAC region as a whole, and for an increasing number of countries.
Although this report looks at LAC as a whole, it acknowledges the considerable differences among the region’s countries, with regard to individual trade relations with China. This section takes a closer, comparative look at Brazil and Mexico’s trade with China by 2035 across different scenarios. In addition to being the largest LAC economies, both countries are China’s main trade partners in the region. Brazil and Mexico’s trade relations with China are different in nature, helping to showcase heterogeneity in LAC and to add nuance to regionally aggregated findings in this report.
Vignettes
Brazil
By 2035, Brazil is likely to become more dependent on China as a trade partner than it was in 2020. That would be mostly driven by China’s rise as a supplier of Brazilian imports, rather than as a destination of exports. Over the period of 2021–2035, Brazil is expected to feel the impact of having its agricultural exports concentrated in the Chinese market as, for various reasons, this segment would lose dynamism when compared with 2000-2020. Against that backdrop, Brazil’s current trade surplus is likely to shrink. Additionally, Chinese imports of LAC materials tend to grow at a slower pace. These are noteworthy developments, given the importance of soybeans and iron ore in Brazil’s total shipments to China, its overall main export market.
Key Highlights:
- China remains Brazil’s top trade partner in 2035, ranking first among both Brazil’s import and export markets. In 2035, Brazil represents around 50 percent of China’s trade with LAC. These are common features shared across the four scenarios in this report.
- The base-case scenario (Current Path) suggests that Brazil keeps running trade surpluses with China, but smaller ones than in 2020. In one scenario (Demise of the Agricultural Bonanza), China-Brazil trade is roughly balanced.
- In the Balancing Act Scenario, however, Brazil registers its first consistent trade deficit with China since 2000 (-0.7 percent of its GDP). The contrast with the situation in the early 2020s is stark. In this scenario, and only here, Brazil has an overall trade deficit by 2035.
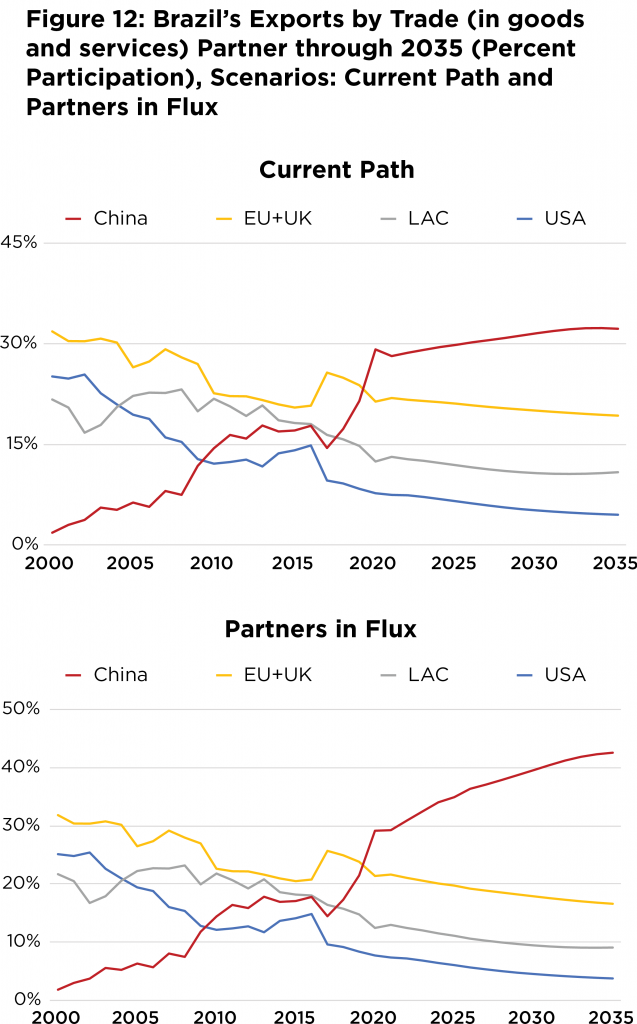
- The Current Path Scenario estimates that Brazilian exports grow more dependent on China. Considering the different scenarios, China’s share in Brazil’s exports would be somewhere between 22 and 42 percent in 2035.
- Brazil’s export dependence on the United States is expected to decrease, reaching 4.5 percent in 2035 in Current Path. If confirmed, that would be a historically low mark for Brazil’s exports to the United States.
- In the most dramatic scenario (Partners in Flux Scenario), Brazilian exports to all its other main markets (US, EU, LAC) decline and its exports to China increase, which results in an unprecedented level of concentration in the Chinese market (Figure 12). Under those circumstances, by 2035, more than 40 percent of all Brazil’s exports would be destined for China.
- To varying degrees, all scenarios anticipate for 2035 a state where, in comparison to 2020: China’s share of Brazil’s imports rises; the US share of Brazil’s imports remains relatively stable; the EU (plus UK) share of Brazil’s imports declines; and LAC participation in Brazil’s imports remains stable or faces a small reduction.
Mexico
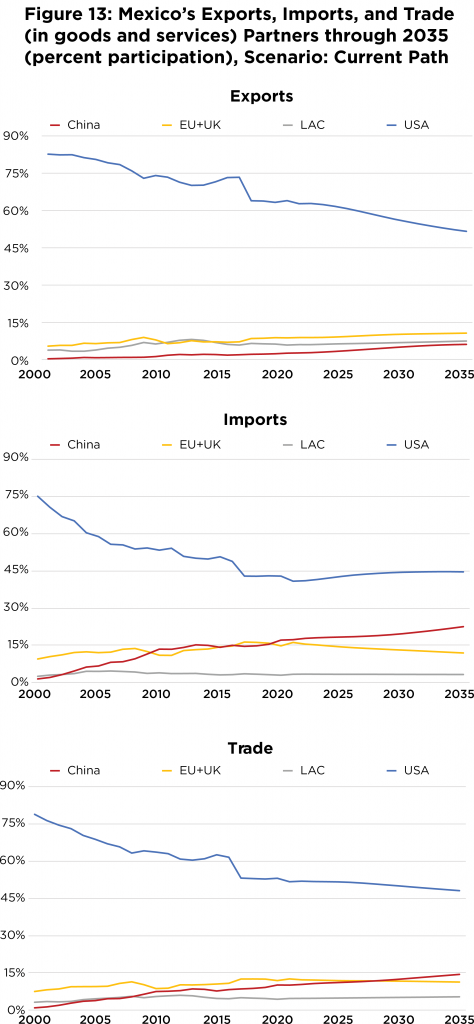
Between 2021 and 2035, the United States is expected to retain (or even increase) its market share in Mexico’s imports (Figure 13). This is exceptional in a region that is becoming more dependent on Chinese imports. Such distinct development reveals the depth and strength of US-Mexico trade relations, of the regional supply chains, and of the United States’ historical ties with its southern neighbor.
Looking at Mexico’s exports in 2035, China is expected to gain importance, but its share would still be relatively small—between 10 and 20 percent. Interestingly, from 2021 to 2035, Mexico is expected to reduce its export dependence on the United States, but China would not be the only driver of that outcome.
Key Highlights:
- Across all scenarios, the United States remains Mexico’s top trade partner by 2035, with China coming in second.
- China tends to gain ground as Mexico’s export partner compared to 2020, but under none of four scenarios would the level of dependence be significant. It would reach around 11 percent at most (in Partners in Flux Scenario).
- Following a clear trend seen since the turn of the century, Mexico is bound to reduce its dependence on the United States as an export market by 2035 (a drop of more than 10 percent in all four scenarios). In one scenario (Partners in Flux), Mexico’s dependance rate toward the United States would fall below 50 percent, an unprecedented mark. China’s rise as a destination for Mexican exports would account for around half of the reduction in Mexico’s export dependence on the United States.
- In all the scenarios explored in this report, Mexico’s trade deficit with China is expected to increase by 2035, falling somewhere between 5 and 9 percent of the Mexican GDP. In 2019, China’s surplus with Mexico was high enough to feature among the seven largest surpluses it ran globally.
- In all four simulations, China’s share of Mexico’s imports rises. It could reach up to 29 percent by 2035 (Balancing Act Scenario), which would mean an increase of more than 10 percentage points in comparison to 2020. The Current Path scenario takes a more moderate view, though, with 22.5 percent of all Mexico’s imports coming from China in 2035.
- Mexico’s import dependance on the United States is not expected to undergo dramatic changes in 2021– 2035. In fact, as in the case of Brazil, China’s growing relevance as a source of imports would happen at the expense of the EU and UK taken together.
IV. Conclusions
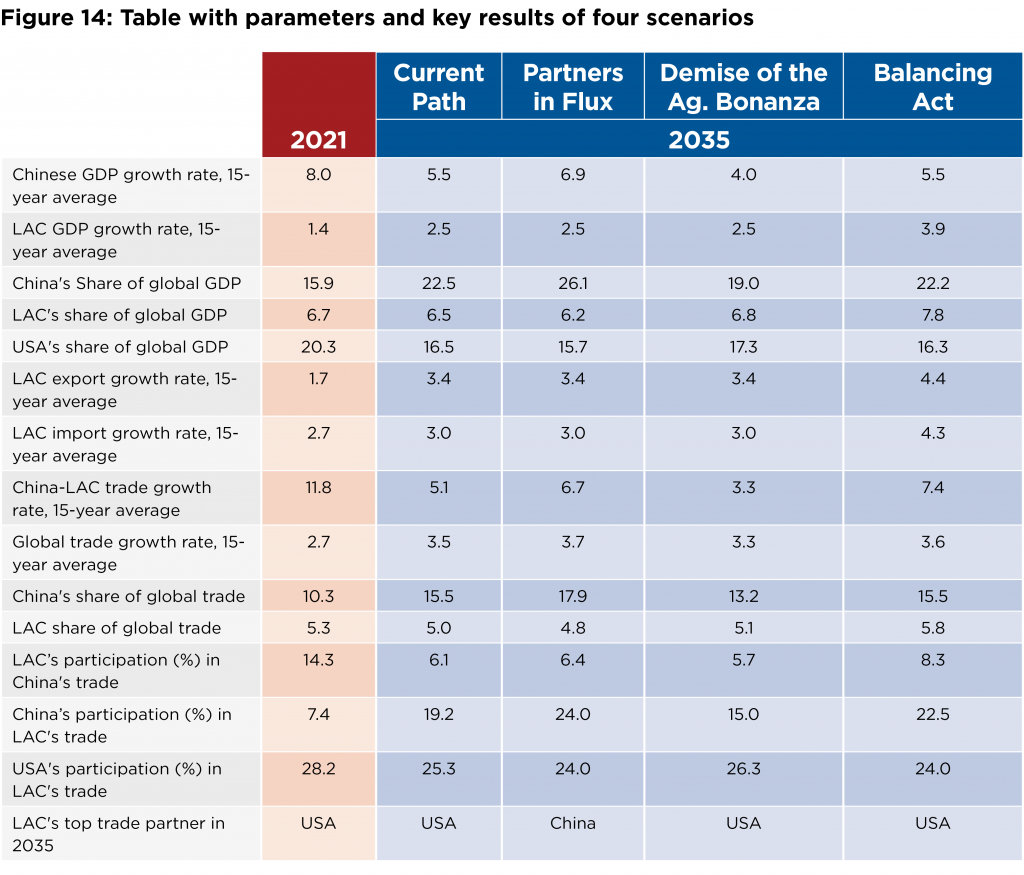
This report explored four scenarios, based on different—but plausible—assumptions and corresponding outcomes (see Figure 14). In an attempt to identify some common threads across different scenarios, surprising and interesting developments emerged. Here are the main takeaways and recommendations for policymakers and other stakeholders in LAC, China, and the United States, seen through the three main analytical lenses of the report (trade partners, sectors, and balance). Main takeaways are in bold; icons on the margin indicate key recommendations and their intended audience (LAC, the US, or China).
Trade balance, rising imports, and adjustment costs
Ultimately, by 2035 China and the United States will compete for the position of top LAC trade partner—a title historically held by the latter. At the same time, China’s growing presence in LAC trade is far from an exclusive feature of the region, but rather a sign of China’s rise as a global trade partner.
Regardless of who comes in first in 2035, a key finding of this exercise is that China is still gaining ground in LAC trade, and is likely to continue to do so through 2035. The scenarios estimate that, by then, China’s participation in overall LAC trade may range from 15 to 24 percent. While a participation around one quarter of the region’s trade may not look particularly high, the fact that China accounted for less than 2 percent of LAC trade in 2000 makes the 2035 mark stand out.
When trade flows are disaggregated into exports and imports, it is clear that imports from China—rather than exports to China—would drive China’s growing participation in LAC trade. This, in turn, has implications for the LAC-China trade balance, as well as LAC governments’ commercial strategies. For many in the region, both the former and the latter have benefitted from robust exports to China between 2000–2020.
For LAC, the rise of China results in a trade distribution that is geographically more balanced among different partners. Experiences, however, vary across the region, with Brazil as the notable exception—where China leads to more concentration, instead of more diversification, of export markets.
In many cases, increased trade dependence on China could translate into reduced dependence on the United States. These dynamics should serve as an eye opener for US stakeholders. A deliberate US effort to strengthen relations with the neighboring region could benefit US policy and business interests alike. Building on strong and historical ties between the United States and LAC, a positive agenda that includes trade and investment could help materialize a revival of the diminishing dynamism in this bilateral trade relationship. Renewed US interest in the region is a net positive, particularly for LAC countries keen on promoting trade and investment.
Remarkably, across all four scenarios, the United States’ relevance as a destination of LAC exports declines. Business leaders and government officials in the Americas should explore the causes and potential actions to ensure that high value-added LAC products still meet demand in the United States, an important market for LAC manufactured goods. The result should also serve as a reminder for the urgent need to tackle issues undermining LAC export competitiveness, particularly in the industrial sector.
LAC intraregional trade has lost relative importance over the past ten years. The scenarios indicate that, for the next fifteen years, intra-LAC trade is unlikely to regain the prominence seen in the past. If deepening economic ties among LAC countries is a desired goal for the region, the results of this report should serve as a warning signal for LAC policymakers and other stakeholders.
Sectoral Evolution
In terms of sectoral composition, a striking feature of LAC-China trade in 2035 is the likely decline of agriculture in the region’s total exports to China. This trend featured most prominently in Scenario 2 (Demise of the Agricultural Bonanza), but the relative decline was also present in the other three scenarios.
Countries across LAC should prepare for this and other shifts in the profile of their exports to China. Governments and businesses leaders would need to quickly adapt to changing circumstances, such as by developing new destination markets. As the economic model shows, African consumers would help to fill that gap.
Another related challenge refers to the enduring issue of how to add value to LAC exports in general, but mostly to China. As the report indicated, opportunities will arise for LAC to export processed goods to China, but making the most of them would require LAC to overcome its own domestic challenges related to competitiveness. At the same time, LAC stakeholders should undertake a deliberate and sustained effort to better understand the Chinese market, to properly promote their exports, or to join existing and new value chains in China/Asia beneficial to economic development in LAC. LAC stakeholders should not underestimate the still-wide knowledge gap in the way of developing market opportunities in China
Trade Balance
Regarding China-LAC trade balance in 2035, a key conclusion of this report is that, despite differences among countries, LAC as a region will probably have a higher trade deficit with China (as a proportion of GDP) than it did in 2020. In only one of the four scenarios would the deficit be smaller than it is today.
While a trade deficit itself should not be considered a negative development, it remains an important data point in assessing trade relations, given the broader economic implications attributable to trade deficits and other associated factors. In addition, the findings of the report serve as a reminder for LAC and Chinese stakeholders that large trade deficits can be exploited politically, triggering protectionist responses and raising tensions between trade partners.
The different scenarios indicate that the size of the trade deficit could range from 0.5 to 3 percent of the region’s GDP—which is not dramatic. At the same time, trade balance is another area in which the aggregation of LAC countries dilutes important discrepancies. Across the four scenarios, Argentina, Bolivia, Colombia, Mexico, and Paraguay run trade deficits with China by 2035. Peru and Uruguay, on the other side, accumulate surpluses in all four of them. Brazil is likely to see its exuberant surpluses with China dwindle.
Manufacturing imports from China are expected to increase, leaving a mark on the region’s trade balance. Additionally, agriculture would not provide the same boost to LAC exports as it did around the 2020s. The model also predicts that, by 2035, exports of LAC materials to China would not enjoy the same dynamism of today. Over time, that would put additional pressure on the LAC trade balance with China.
While 2035 is not too distant in the future, LAC trade relations with China may unfold in multiple ways. With uncertainties abounding, stakeholders are better prepared to act today if they proactively contemplate and plan for the future. This report helps to support a forward-looking exercise for China-LAC trade relations, inspiring action-oriented reflections.
Appendix – Methodology
Scenarios framework
Economic growth and circumstances affecting bilateral trade (such as trade policies and complementarity) are two of the most important factors associated with the future of trade between China and LAC. These dimensions also carry with them a fair amount of uncertainty. Therefore, to better understand this uncertainty, the report brings these two dimensions together in a two-by-two framework, in which each dimension maps to one axis, and whose intersection defines four quadrants (see Figure 15 below). These four quadrants each represent a scenario that can be described according to their position in the two-by-two grid below.
However, because what drives Chinese imports from LAC is typically unrelated to what drives LAC imports from China, and because different growth patterns across the two regions could result in very different futures (domestically, bilaterally, and globally), two frameworks are required to properly cover the space of possible futures; one for China and the other for LAC.
The assumptions used in crafting these scenarios include the following.
- Economic growth: Operationalized as GDP growth rates that are 1.5 percentage points higher or lower than the Current Path values for China/LAC.17Growth assumptions are a combination of the International Monetary Fund’s global economic outlook estimates and estimates by the IFs model
- Trade relations: Operationalized through a 50-percent reduction or increase in tariff rates imposed by China/ LAC on imports from LAC/China; a 10-percent reduction or increase in trade complementarity (as per the World Bank’s Trade Complementarity Index), bringing China/LAC exports more in line with LAC/China’s imports; and a reduction or increase in Chinese/LAC NTBs impeding LAC/Chinese imports (for example, sanitary requirements affecting imports of foodstuff or licensing procedures creating bureaucratic obstacles to the imports of certain products).18Without variables directly related to NTBs, these assumptions are approximated using a 10-percent reduction or increase in imports between China and LAC
In total, this framework describes nine scenarios: eight located in the two-by-two quadrants plus this study’s business-as-usual scenario: the Current Path. The Current Path is a collection of dynamically evolving variables simulating a future in which human and economic development evolves as it has for the last several decades. It does not include any major disruptive events, nor significant shifts in policy. The Current Path is the foundation on top of which the other scenarios are built and serves as reference for alternative futures.
For conciseness, this report does not cover the nine scenarios. In addition to the Current Path, the authors selected an additional three scenarios that allowed them to better explore the prospects for China-LAC trade according to: partners (their relative importance in one another’s imports and exports); sectoral composition of imports and exports in bilateral trade; and trade balance. These scenarios include (Figure 16):
- Partners in Flux, which describes a future in which China enjoys higher economic growth and stronger trade relations with LAC (through an increase in TCI and reduced tariffs and NTBs);
- Demise of the Agricultural Bonanza, which describes one in which China’s economy slows and trade relations with LAC deteriorate; and
- Balancing Act, in which LAC grows more rapidly and introduces policies aimed at increasing imports from China.
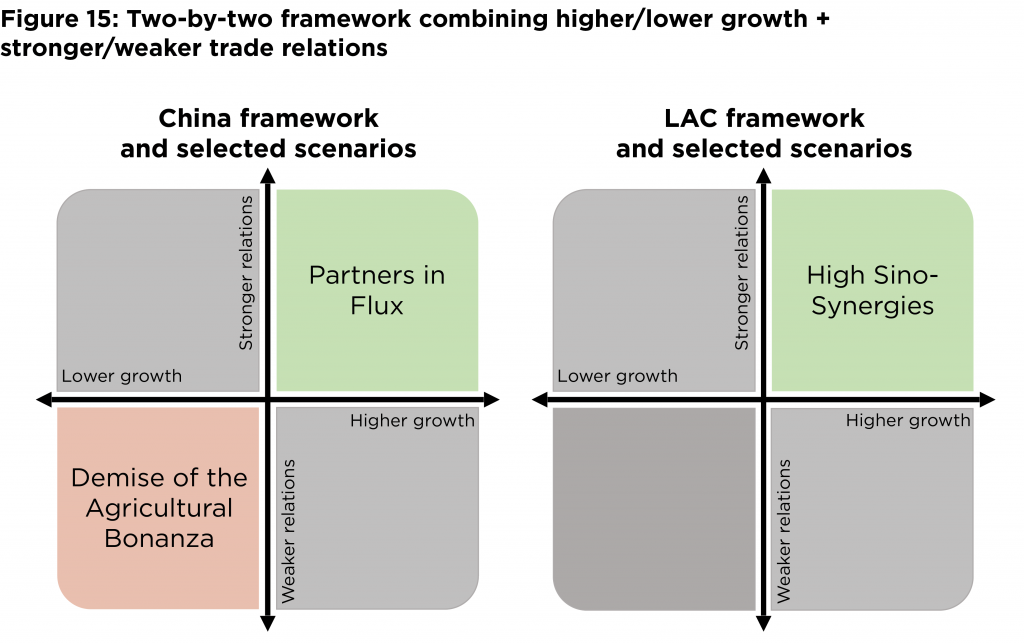
Respectively, the quantitative assumptions for the selected scenarios are as follows.
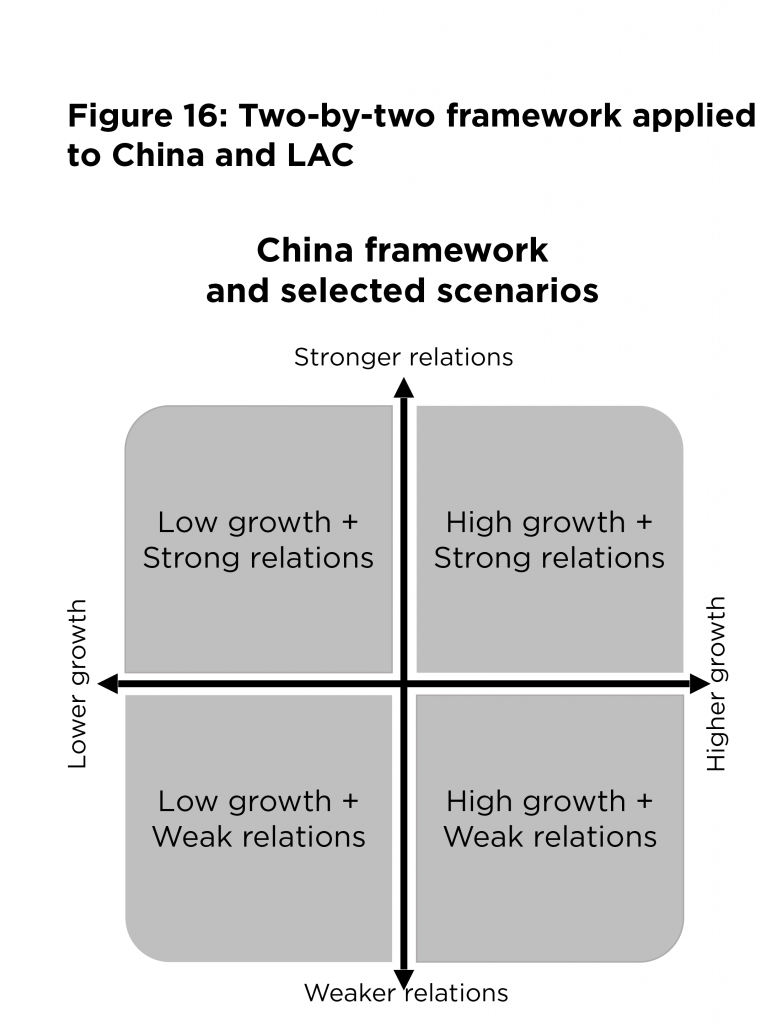
Scenario 1, Current Path (Base Case): The base case represents a continuation of existing trends and policy choices; a projection of the status quo of China-LAC trade relations over the next fifteen years. It does not include any disruptive events such as global pandemics or widespread shifts in policy. In the base case, China grows, on average, 5.5 percent per year between 2021 and 2035, whereas LAC averages 2.5 percent annually.
Scenario 2, Partners in Flux: High Chinese GDP growth and improved trade relations with LAC. Between 2021 and 2035, China’s economy expands by an annual average growth rate of 6.9 percent. During this period, the country improves its trade relations with LAC by eliminating half of the Chinese import tariffs and reducing non-tariff barriers (resulting in a 10-percent increase in imports coming from LAC). Over this period, LAC exports align with China’s import demand (a 10-percent increase in trade complementarity as measured by TCI).
Scenario 3, Demise of the Agricultural Bonanza: Low Chinese GDP growth and deteriorated trade relations with LAC. Between 2021 and 2035, China’s economy expands with an annual average growth rate of 4 percent. During this time, trade relations with LAC deteriorate due to a 50-percent increase in tariffs, an increase in non-tariff barriers (resulting in a 10-percent decrease in imports from LAC), and a 10-percent reduction in LAC export complementarity to China.
Scenario 4, Balancing Act: High LAC GDP growth and improved trade relations with China. Between 2021 and 2035, the LAC economy expands with a higher-than-expected annual average growth rate of 3.9 percent. During this time, trade relations with China improve with the elimination of half of LAC tariffs, a reduction of non-tariff barriers (resulting in a 10-percent increase in Chinese imports), and a 10-percent increase of China’s export complementarity to LAC.
Modeling trade
The International Futures (IFs) is a long-term, global, integrated assessment model with the broad aim of projecting economic, human, and bio-physical development across country-specific, regional, and global futures over the medium to long term, and across a wide range of issues.19For more information, see “Announcing the Pardee Center’s 2019–2020 Annual Review,” Frederick S. Pardee Center for International Futures,” https://www.pardee.du.edu. Bilateral trade projections in IFs are estimated using a two-stage trade model. In the first stage, the authors estimate country-level exports and imports across six economic sectors (services and five goods sectors). Embedded within the broader IFs system, these projections are informed by a wide range of variables related more broadly to the economy, such as resource constraints in physical sectors (agricultural and energy) and sector-specific demand for goods and services that are responsive to demographic dynamics and savings/ consumption patterns. Estimating sector-level supply and demand for 186 countries allows IFs to create a global market, with price signals informing the final demand for imports and exports.20For more information regarding see the IFs economics model documentation: https://pardee.du.edu/wiki/Economics
In the second stage, the model distributes country-level exports and imports across all other potential trade partners. This distribution first follows the historical pattern of bilateral trade (estimated from United Nations Comtrade data), then evolves according to a variety of indicators that promote trade (such as the overall size of an economy) and obstruct it (such as distance and tariffs).21For trade in goods, the authors use the BACI database from CEPI (http:// www.cepii.fr/). This database is built from and improves upon UN Comtrade data by reconciling declarations recorded by exporting and importing partners. For bilateral service data, the authors use the UN Comtrade data directly. Discrepancies between country-level and bilateral trade data are handled in a reconciliation process, which can result in further adjustments to BACI/Comtrade-based estimates of bilateral flows. In the case of tariffs, there exist additional pathways back to the country-level macroeconomic projects through: prices, which may change the balance of supply and demand; and the contribution of tariffs to government revenue.
Within this structure, trade between China and LAC is influenced not just by the macroeconomics of both regions and the conditions impacting their trade relations, but also by trends such as the growth of agricultural imports from Africa due to rapid demand growth and limited production capacity, or the rise of renewable energy and its impact on trade dependence on fossil fuels. Finally, results reported in this study should not be understood as predictions about a specific value of trade, participation, or composition, but rather as a means to better understand the ways in which China and LAC trade relations might unfold in light of great uncertainty.
ACKNOWLEDGEMENTS
We would like to thank the Atlantic Council for the opportunity to share innovative ideas and analyses on trade and investment for Latin America and the Caribbean, specifically in relation to China-Latin America trade. In times of uncertainty, we hope this report provides stakeholders with a sound basis to proactively design public policies and business strategies.
At the Atlantic Council would also like to thank Jason Marczak and Peter Engelke for their guidance and excellent contributions that have greatly improved this report; Wazim Mowla, Eva Lardizabal, and Susan Cavan for editorial assistance; and Donald Partyka for design support. Finally, a special thank you to the University of Denver’s Pardee Center for nternational Futures, its director Dr. Jonathan Moyer, and colleagues including Yutang Xiong, José Solórzano, and Barry Hughes, for their excellent work in economic modeling and forecasting, which provided the foundation for this analysis. Our thanks to James Kimer of Media Theory for assistance in the creation of this report page.
Tatiana Prazeres, David Bohl, and Pepe Zhang
About the Authors
Tatiana Prazeres
Tatiana Prazeres is a senior fellow at the University of International Business and Economics in Beijing, China, where she teaches international trade. She writes a weekly column on China for Folha de S. Paulo, one of Brazil’s most prestigious newspapers. She is also a nonresident senior fellow at the Center for China and Globalization. Prior to these appointments, she was senior adviser to the director-general of the World Trade Organization between 2013 and 2018. Her portfolio included trade negotiations, market access, services, investment, agriculture, trade and environment, and engagement with the private sector. Before that, at the age of thirty-one, Tatiana Prazeres became the youngest-ever secretary of foreign trade of Brazil. During her term, she reformed Brazil’s trade-remedies system, advanced trade-facilitation reforms, and secured government’s approval to pursue negotiations on investment facilitation agreements. She is an active participant of Women Inside Trade, a network of female trade specialists. She holds a PhD in International Relations, and degrees in law and international relations. In 2014, she was recognized by the World Economic Forum as a Young Global Leader.
David Bohl
David is the assistant director of analysis at the Frederick S. Pardee Center for International Futures at the University of Denver’s Josef Korbel School of International Studies. His research has focused on the development, use, and promotion of systems applications; supporting long-term strategic-planning efforts of national governments, intergovernmental organizations, and corporations across four continents. His recent projects include impact assessments, trends reports, scenario analyses, and training programs for organizations such as the United Nations Development Programme (UNDP), the United States Agency for International Development (USAID), and the African Union Development Agency (AUDA-NEPAD).
Pepe Zhang
Pepe Zhang is an associate director at the Atlantic Council’s Adrienne Arsht Latin America Center. Zhang leads the Center’s China-Latin America portfolio, which provides timely insight on the growing relations between the two regions through multi-perspective and forward-looking analyses and events. Zhang also coordinates the center’s work on broader regional economic issues, such as coronavirus and post-COVID Latin America, international trade and investment, and macroeconomics. Zhang frequently provides English, Spanish, and Chinese-language commentary on these issues to US and international press outlets and through speaking engagements.
Prior to joining the Atlantic Council, Zhang worked at the Inter-American Development Bank, focusing on international trade and investment promotion, entrepreneurship, and technology in Latin America and the Caribbean, with a special emphasis on China-Latin America connections. Zhang holds a master’s degree in international economics from the Johns Hopkins University’s Paul Nitze School of Advanced International Studies (SAIS), and a bachelor’s degree from Pomona College in Latin American Politics and Spanish. Zhang is fluent in Spanish, English, and Chinese, and has extensive professional and academic experience across Latin America, China, and the United States.
A Note from the
Atlantic Council
We would like to thank HSBC for supporting our work, as we try to provide a deeper and more nuanced understanding of China’s activities in the region, as well as the economic and geopolitical implications for the United States. The Atlantic Council is pleased to partner with HSBC to contribute vital thought leadership on these issues, through this publication and six previous reports.
We would also like to thank David Bohl and Tatiana Prazeres for working with us on this incredibly innovative and insightful report. Their expertise, commitment, and numerous hours spent on research and writing are evident throughout the pages. Amid the COVID-19 pandemic and its overwhelming short-term impacts, this unique, forward-looking report highlights the importance of proactive and long-term planning in trade and other economic issues.
At the Adrienne Arsht Latin America Center, we recognize LAC (Latin America and the Caribbean) as a key, innovative, and active player on the global stage. In this light, the report offers insight into future commercial scenarios in China-LAC trade, thus triggering policy discussions and informing actions among public and private-sector stakeholders in LAC, as well as in the United States and China. We hope this report can help them navigate and prepare for the myriad potential opportunities and challenges ahead.
Jason Marczak
Director
Adrienne Arsht Latin America Center
Atlantic Council
Pepe Zhang
Associate Director
Adrienne Arsht Latin America Center
Atlantic Council
The Adrienne Arsht Latin America Center broadens understanding of regional transformations through high-impact work that shapes the conversation among policymakers, the business community, and civil society. The Center focuses on Latin America’s strategic role in a global context with a priority on pressing political, economic, and social issues that will define the trajectory of the region now and in the years ahead. Select lines of programming include: Venezuela’s crisis; Mexico-US and global ties; China in Latin America; Colombia’s future; a changing Brazil; Central America’s trajectory; Caribbean development; commercial patterns shifts; energy resources; and disinformation.