Running out of road: China Pathfinder 2023 annual scorecard
Table of contents
Chapter 1: The past explains the present
Xi’s first third plenum, a decade later
2022 and 2023: Pandemic obscures problems
The Pathfinder framework & updates to research design and methodology
Chapter 2: Historical baseline and 2022 stocktaking
Financial system development
Market competition
Modern innovation system
Trade openness
Direct investment openness
Portfolio investment openness
Foreword
2023 was never going to be the year of China’s economic resurgence. While some analysts anticipated the end of zero-COVID policies would unleash pent-up consumer demand and revive corporate animal spirits, those who understood the deep structural nature of China’s economic malaise have been bracing for impact.
Now, many around the world are finally coming to terms with reality—the Chinese economy is suffering in part because the Party continues to prioritize ideology over economic dynamism.
In 2023, China’s GDP will likely grow at less than 4 percent for only the third time in the past twenty years. And this raises two fundamental questions: How will Xi Jinping, now in his third term, respond? And how will the other major economies around the world handle these tectonic shifts?
In leading market economies, the increasing emphasis on national security in economic decision making has been perhaps the most significant development in international economics.
For the past several years, the US and Europe have demonstrated an increasing willingness to use the tools of economic statecraft to begin the so-called process of “de-risking.” This includes export controls and outbound investment screening for certain national security technologies. While the moves are not surprising from a US perspective, the fact that counties like Germany—long dependent on China for its export market—has been willing to engage in these conversations represents a significant shift.
China has responded in kind—including accelerating work on its own semiconductor capacity and introducing controls on the export of critical minerals gallium and germanium.
Missing amid this escalation is a proper look at the broader implications. What does it mean if the world’s second-largest economy can’t recover from its economic malaise? How high are the risks of the tools of statecraft being perceived as crossing a line from competitive action to national security threat?
These questions become more pressing as elections approach in Taiwan and the US in 2024.
This where the China Pathfinder framework offers valuable insights. Now in its third year, China Pathfinder gives policymakers a way to distinguish the signal from the noise of Chinese economic policy decision-making. With the benefit of tracking changes in China’s performance along more than 25 economic indicators across multiple years, we can move beyond instant reactions to identify where China is actually making strides toward market reform. We can also identify the areas where China is backsliding.
The goal of Pathfinder has always been to create a shared language on China’s economy for policymakers around the world. The reaction to Pathfinder in its first two years has affirmed that mission. In our meetings with US, European, and Chinese officials, the data we provide in these pages is recognized as useful and revealing, even if these officials disagree on how to act in response. The analysis has been cited around the world and is required reading in many Chinese econ syllabi.
One of the reasons that the project has resonated is that the findings in Pathfinder are not limited to China. Because the purpose of the China Pathfinder study is to compare China to the top ten OECD economies over the same period, one of the most rewarding and surprising parts of this work has been discovering the trajectory of market economies. One of the most significant shifts captured by Pathfinder has been the inclination of some countries to lean on a new form of industrial policy in the last several years.
So, what comes next? While it’s tempting to assume that China’s current trajectory will persist, recent events such as US Commerce Secretary Gina Raimondo’s trip to Beijing and the return of a US-China economic dialogue suggest the story is more complicated. We should not overlook positive signs that come amidst the gloom of political rhetoric. Could China’s domestic economic pressures, including youth unemployment and a floundering property sector, shock Chinese leaders into reversing the statist course they’ve been on since Xi came to power? However unlikely, the possibility remains.
Our hope is that Pathfinder sheds some light on the various paths China may take—and shows that while Beijing has run out of the easy options, opportunities for adjusting the economic model remain viable. The course it chooses will determine its fate—and impact the rest of the world—for years to come.
We thank the dedicated teams from Rhodium Group and the Atlantic Council who have worked tirelessly to make this report a reality. And we thank each of you for taking the time to engage with this critical work.
Josh Lipsky
Senior Director, Atlantic Council GeoEconomics Center
Executive summary
With hopes of a rapid recovery following the dissolution of China’s zero-COVID policy dashed, structural threats to the country’s economic stability have never been greater. Although draconian lockdowns certainly soured the mood of businesses and consumers in China, the economic malaise that policymakers in Beijing are staring down now is not caused by cyclical factors like COVID, but by a failure to reform the country’s economic system. Chinese leadership is aware it needs to undertake significant reforms to shake off the shackles of the current structural slowdown, but previous efforts have fallen far short of the big bang changes that the moment demands.
To track Beijing’s reform efforts, China Pathfinder compares China’s economic system to those of market economies. Using six components of the market model—financial system development, market competition, modern innovation system, trade openness, direct investment openness, and portfolio investment openness—we establish a quantitative framework for understanding China’s progress or regression on reform. China’s outsize role in the global economy and the necessity of reform in maintaining the country’s growth make this work a key to understanding China’s future trajectory.
Key findings
- The economic effects of the pandemic obscured the underlying problems, but developments in 2022 underlined the structural nature of China’s slowdown. Although political expediency led Chinese policymakers to blame the effects of COVID for economic malaise, the implosion of the property sector, cratering market confidence, and rising tensions with Western countries forced an admission of a downturn.
- China has made some reform progress, with trade openness a standout improvement. China’s trade openness is within the range of market norms, and its goods trade practices are likely to remain a point of progress. Despite still being well behind OECD norms, China has also made progress over the past decade in the openness of its financial system, with the score for pricing of credit entering the range of market norms for the first time.
- In the past year, China strayed further from market norms in the areas of market competition and its innovation system. Amid widening global competition over high-tech industries, Beijing has seen a sizeable increase in the presence of stateowned firms in its top companies, tightening of cross-border data rules, and the staying power of industrial policy as a key tool. China’s restriction of academic database access and crackdown on how companies use algorithms has made its innovation system less open.
- Open market economies in some cases moved away from market norms in 2022 due to the state of the global economy. OECD economies saw movement away from market norms in financial system development and portfolio investment, mostly as a result of a decline in market capitalization and falling non-financial corporate debt compared to GDP. These drifts say more about structural changes in the global economy than they do about particular regulatory changes.
- In its current trajectory, China’s economic growth will continue to grind ever slower. This slowdown will impact Beijing’s ambitions for indigenous high-tech development, exacerbate local fiscal crunches, and have spillover effects for other countries who depend on China as an export or import market. The slowdown will also begin to diminish perceptions of China’s state-led economic system, with implications for the competition between Beijing and market economies.
- If Beijing is going to dig its way out of its current economic hole, it needs to allow robust debate and enact concrete reforms. To make positive changes, China should retire its GDP target, rebalance the fiscal burdens that are unequally shared by local and central governments, privatize some of its state-owned assets, and reform its pension system.
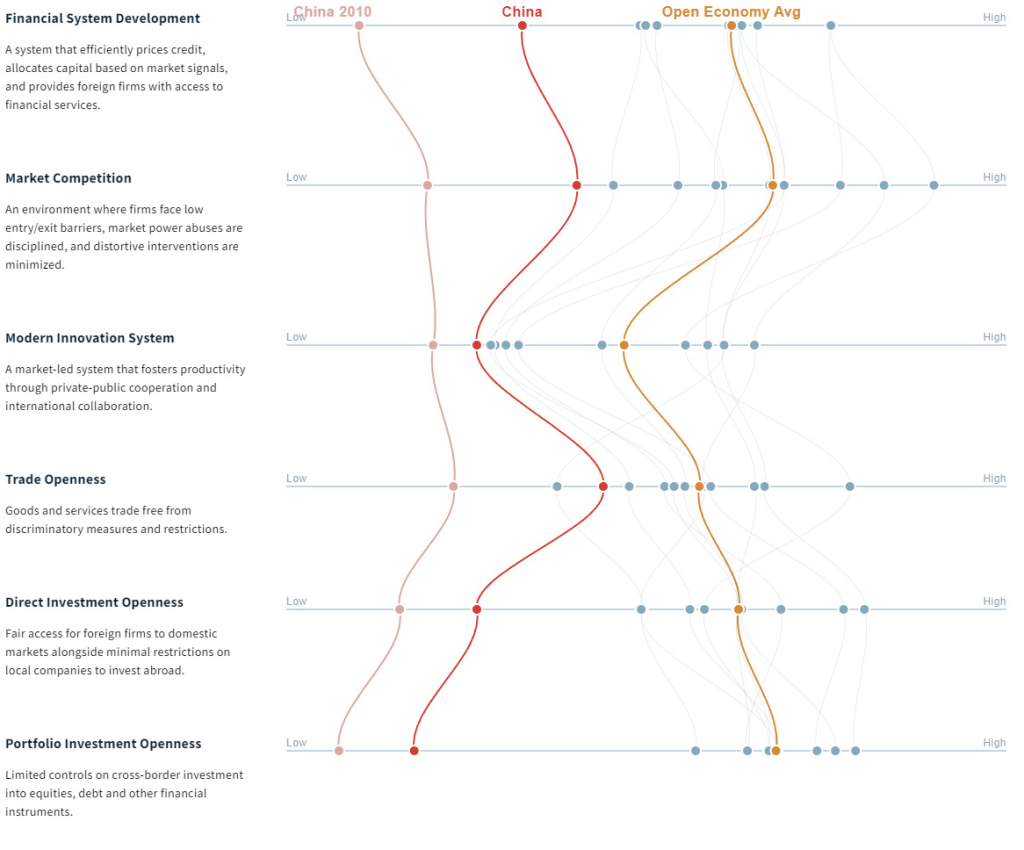
Figure 1: 2022 annual economic benchmarks
Chapter 1: The past explains the present
In 2023, China’s troubled economic performance caught the world by surprise. With COVID behind us, expectations were set for a strong Chinese recovery. Though it paid an awful cost for the abrupt end of zero-COVID, China was assumed by many to be poised for a powerful economic revival as lockdowns ended, freeing businesses and consumers to spend. But instead of a boom, the world has watched China falter. The handful of whispers about growth risks in early 2023 turned into a shouting match among prominent foreign economists by mid-year, jostling to talk about what was wrong with China but focusing largely on cyclical reverberations from the pandemic rather than the longer arc of economic policy ambitions and shortfalls over the Xi Jinping era.
The thesis of China Pathfinder is that China’s leaders explained the structural risks to their economy clearly, a decade ago, and demonstrated seriousness about dealing with them, only to pull back in the face of challenges. Progress toward market economy norms is the key to China’s GDP growth today, as it was in past decades, and the dearth of market convergence since 2015 correlates with the end of high growth. That change to potential growth, and to Beijing’s ability to manage perceptions about it, not only reshapes expectations about China’s domestic performance, but also influences China’s geoeconomic power, resilience in global competition, and relations with the United States.
In this report, we update data indicators on China’s systemic alignment with leading market economies through the end of 2022, and relate those statistics to this year’s macroeconomic malaise. To set the scene for that, we briefly review China’s policy trajectory over the past decade, which makes clear why the China Pathfinder framework is designed to gauge alignment with advanced market economy systems.
Xi’s first Third Plenum, a decade later
In November 2013, Xi Jinping—then in his first year at China’s helm—set his economic policy course, at the Third Plenary Session of the 18th Central Committee of the Communist Party of China. With the laissez-faire missteps of the global financial crisis still stinging, the Third Plenum communiqué was surprising for its pro-market orientation. A signature instruction was to “make the market decisive.” More than two hundred specific reforms grouped into “60 Decisions” included pruning the role of state enterprises, completing center-local fiscal reform, reforming corporate governance, and promoting competition.
Taken together, this extensive plan was a genuine commitment to economic reform in alignment with market economy principles and not merely an aspiration formulated abroad. The terms of China’s WTO accession in December 2001 provided the same evidence a decade earlier, but it is important to establish that this was the intended course in the Xi era as well—at the beginning. Over the following years, Beijing made significant efforts to implement the plan. Premier Li Keqiang endorsed the premise that his government should be judged, even by foreign press.
The motivations for serious reform were clear: if they were not achieved, President Xi himself penned, China would find itself in a blind alley. As we wrote in the precursor study1Daniel H. Rosen, “Avoiding the Blind Alley: China’s Economic Overhaul and Its Global Implications,” Asia Society, October 2014. https://asiasociety.org/policy-institute/executive-summary-introduction. to China Pathfinder in 2014, one year after the Third Plenum (edited for brevity):
“We project that China’s potential GDP growth in 2020 will be 6 percent. Half through investment, the other half [from] more efficient use of resources (what economists call total factor productivity). Such growth depends on new rules and institutions that let markets steer resources—people, money, and materials—to where they can generate the highest growth. Without this marketization— which depends on both re-regulation and a new mindset about the roles of the Party and the government—the gains from productivity would all but evaporate. Growth driven only by investment would mean a hard landing: no better than 3 percent annual GDP growth. Falling productivity could easily pull private investment down with it, leaving GDP growth even lower at 1 percent, surely a crisis.”
Going into 2020, growth was indeed 6 percent. After the COVID interlude, the question is whether China can return to that growth rate, or will slow to the 1-3 percent range we projected. Present indications suggest the latter, due to prioritization of political control over efficiency that has characterized the Xi era since the start. While officials explicitly recognized the risk of low-productivity statist lethargy in 2013, they judged the allure of foreign political and social ideas even greater, as shown by other policies. The same year as the 60 Decisions plan, an ideological communique was issued painting Western constitutional democracy as “an attempt to undermine the current leadership and the socialism with Chinese characteristics system of governance.”
The 2013–2020 period was essentially a test of whether Beijing could find a way to achieve market economic goals without embracing a more liberal political system. As of 2023 it would appear the result was negative: economic reforms were not completed, while political priorities took precedence.2Daniel H. Rosen, “China’s Economic Reckoning: The Price of Failed Reforms,” Foreign Affairs, June 22, 2021. https://www.foreignaffairs.com/articles/china/2021-06-22/chinas-economic-reckoning.
For Xi, who started an unprecedented third term as leader in 2022, the set of systemic challenges laid out in 2013 remains unchanged, but the magnitude of these economic problems (such as the debt load, fiscal shortfalls, innovation gaps, and dependence on investment-led growth and exports) have only increased. The 60 Decisions list of necessary policy reform work remains the best benchmark for China’s ability to realize its potential GDP growth potential. President Xi was correct, as Deng Xiaoping had been before him, in saying that “if we do not implement reform and opening to the outside world, do not develop the economy and raise the people’s living standards, we will find ourselves in a blind alley.”
2022 and 2023: Pandemic obscures problems
The inability of China’s largest property developers to cover debt payments in mid-2021 marked the end of an era. The property sec-tor, responsible for as much as a quarter of GDP growth and almost half of investment, could no longer serve as the anchor of economic expansion expectations. Other risks were evident in 2021 as well, as discussed in previous China Pathfinder reports, including (among other things) falling household incomes, declining productivity, elevated tensions with major trading partners, and unclear signaling to private entrepreneurs and foreign investors.
The market-oriented prescription for these challenges would be a frank and urgent reform agenda for 2022. Instead, the Communist Party took a political approach centered on controlling the public narrative to project stability and administrative control. The 20th National Congress of the Chinese Communist Party was looming in October 2022, and it was clear, after years of crackdown on dissent, that spinning a positive message celebrating the CCP’s success in steering the economy through challenging times at that political event was paramount. The Party intensified zero-COVID policies in the run-up to the Congress, downplayed structural concerns, and attributed economic challenges such as weak property demand and investment to the pandemic, rather than structural issues.
Behind the COVID veil, three realities forced Beijing to admit missing its GDP growth target in 2022 for the first time. The first and foremost was, as noted above, the property sector. China’s annual housing starts peaked at 1.71 billion square meters in early 2021, enough for around 18 to 19 million houses. With the revelation that those property developers didn’t have the money to service their debt or finish construction, that number fell 52 percent to only 881 million sqm at the end of 2022—a huge bite out of business investment. Second, 2022 market confidence continued to suffer from contradictory policies on data handling that cast uncertainty over the operation of promising sunrise sectors including social media and artificial intelligence. Third, and crucially, the outlook for China’s commercial interactions with major western nations starting with the United States continued to sour, with Beijing maintaining an uncompromising posture as export controls, investment controls, and other China de-risking policies were developed abroad. Contrary to rosy official statistics, US and EU foreign direct investment to China as measured by independent researchers displayed a steep downturn. We relate these economic headwinds to specific policy reform areas in Chapter 2.
Insistence on blaming the 2022 growth shortfall on the pandemic rather than structural realities led to misguided expectations for 2023. After the November abandonment of zero-COVID restrictions, authorities started messaging a return to high, pre-pandemic 5-6 percent GDP growth as the anchor for this year. As discussed in our Q2 2023 quarterly report,3Daniel H. Rosen et al., “China Pathfinder: Will Sluggish Growth Trigger Green Shoots of Reform? Q2 2023 Update,” Atlantic Council and Rhodium Group, August 2023. https://www.atlanticcouncil.org/wp-content/uploads/2023/08/ChinaPathfinder_Q2_2023_report_2B.pdf. this was completely unrealistic, but at the start of 2023 it was taken as reliable by the vast majority of observers in finance, manufacturing, government, and international organizations. By midyear, that confidence had evaporated and debates about “the end of the Chinese economic miracle” were in full swing.
Views on China’s current economic situation can be grouped into five camps, starting with the perspective taken in the China Pathfinder framework and its precursor program (China Dashboard and Avoiding the Blind Alley) since 2014. The assessment in this body of work is as presented above: that China is a transition economy, its potential growth rate is contingent on carrying through on incomplete structural reform, that Xi Jinping and the CCP have stated as much, and that years of delayed structural reform to foster market economy incentives has left China with nothing to replace property and infrastructure debt bubbles after they were exhausted in 2021. We are not alone in this view although we have stood by it most consistently.4Popular writers such as Paul Krugman and well regarded commentators like Mike Pettis sit comfortably in this camp today. Beyond this structural view, we see four other distinct camps presently.
First, some observers argue that China is experiencing a cyclical slowdown, and that it is caused by faltering household consumption triggered by their leaders’ extreme responses to COVID.5Adam Posen, “The End of China’s Economic Miracle: How Beijing’s Struggles Could Be an Opportunity for Washington,” Foreign Affairs, https://www.foreignaffairs.com/china/end-china-economic-miracle-beijing-washington. While those policies were unceremoniously jettisoned almost a year ago, the argument goes, they left a long economic malaise. Seen through this lens, if authorities provide sufficient assurance that they’ll leave individuals alone, households will start spending money they’ve been saving. Consumer confidence is definitely lacking, but this likely has as much to do with weak income and employment growth as a buildup of precautionary savings. Some of the household savings buildup in recent years is also related to paying down mortgage debt. In considering this hypothesis it is also important to consider the declining capacity of fiscal policy and credit expansion to generate investment growth to offset household slack, particularly among local governments.
Second, the authors of the World Economic Outlook (WEO) series at the IMF are the most authoritative source for comparative forecasts of national growth.6“World Economic Outlook Update: Near-Term Resilience, Persistent Challenges,” IMF, July 2023. https://www.imf.org/en/Publications/WEO/Issues/2023/07/10/world-economic-outlook-update-july-2023. The summer 2023 WEO update takes the view that China’s GDP is unchanged at midyear from where it was forecast earlier in the year—at 5.2 percent—but that the composition underlying it has shifted. In a mirror image of the COVID consumer disorder above, the IMF argued that China’s consumption growth has been strong enough to hold GDP growth constant despite COVID restrictions, rising unemployment, plummeting property investment, and a negative contribution of net exports to overall growth. Given that household consumption is only 38 percent of China’s economy, it is hard to accept that its growth alone has been enough to drive 5 percent economic growth in China this year.
Third, a few observers argue that conditions in China aren’t bad, and that we are already seeing a V-shaped recovery back to pre-pandemic growth rates. In this view, neither consumption nor investment is a structural drag on growth. In volume terms, imports are recovering and household savings are declining—these indicators support a strong recovery story and that growth will recover its strength in short order.7Nicholas Lardy, “How serious is China’s economic slowdown?,” Peterson Institute for International Economics, August 17, 2023. https://www.piie.com/blogs/realtime-economics/how-serious-chinas-economic-slowdown, and Andy Rothman, “The Coming Collapse of China?” Matthews Asia, July 27, 2023. https://www.matthewsasia.com/insights/sinology/2023/the-coming-collapse-of-china/. This argument is difficult to square with even the official data, given that almost all indicators show a deceleration of sequential growth from earlier in the year to the summer, and a continued slowdown so far in Q3.
Finally, a growing body of research is focused on the negative spillovers of decoupling policies on China and other emerging markets. World Bank work on the negative spillovers through the innovation channel,8“US-China decoupling is hurting innovation, World Bank warns,” Financial Times, March 30, 2023. https://www.ft.com/content/93015aab-4b3d-43c7-be9b-ad4af4fc721d. and IMF work on the trade channel,9“The High Cost of Global Economic Fragmentation,” IMF, August 28, 2023. https://www.imf.org/en/Blogs/Articles/2023/08/28/the-high-cost-of-global-economic-fragmentation. for instance, show significant shocks from these trends. Hawkish policymakers in the US explicitly talk about the need to cease enabling China’s fast growth, so it is no surprise to see connections drawn between de-risking policies and the falloff in China’s growth. However, while rising political risk in the US-China relationship is definitely affecting businesses and investors’ China strategies, overall US-China trade reached a record high in 2022, and in any case the nature of China’s economic problems has little to do with external shocks.
In our Pathfinder Q2 2023 report, we described a modest opening in domestic discussion of economic problems among Chinese economists.10Daniel H. Rosen et al., “China Pathfinder: Will Sluggish Growth Trigger Green Shoots of Reform? Q2 2023 Update,” Rhodium Group and Atlantic Council, August 2023. https://www.atlanticcouncil.org/wp-content/uploads/2023/08/ChinaPathfinder_Q2_2023_report_2B.pdf. While most of the discussion of the nature of the slowdown described above has taken place among non-Chinese analysts, the conversation has broadened inside China as well. Numerous retired government officials and Party-affiliated economists, such as Liu Shijin, Yin Yanlin, Xu Lin, and Jiang Xiaojuan, have published speeches or commentaries about the need for serious market reform since May 2023. It is a positive sign that Chinese economists are discussing the state of progress on macroeconomic reforms, but there is a long path between an academic discussion among economists and formal officials and the actual implementation of difficult structural reforms by China’s top leadership.
The Pathfinder framework & updates to research design and methodology
The China Pathfinder framework analyzes China in comparison to advanced economies in our sample across six dimensions that reflect an economy’s market orientation, with three clusters focusing on the domestic economic system (financial system development, market competition, and a modern innovation system) and three clusters covering the external openness dimension (trade openness, direct investment openness, and portfolio investment openness).
The research design is quantitative in nature, including three sets of datapoints for each of these economic dimensions: a composite score, annual benchmark indicators, and supplemental indicators.
China Pathfinder selects a set of four to six annual cross-country comparable indicators for each economic dimension. The data for each indicator are normalized using the Min-Max methodology, and rescaled from 0 to 10. Higher scores indicate more alignment with market economy norms. The composite score for each economic cluster is a simple average of the indicator scores for each country.
Starting with this year’s annual report, the composite score methodology has been revised to better reflect countries’ progress or regression across time. Previous editions have focused on countries’ performance in a particular year, compared to each other. The Min-Max methodology has been updated to calculate one minimum and one maximum across all countries and all years of the sample, for each indicator. The methodology previously would conduct normalization separately for each year, where the minimum and maximum were calculated for only one given year (instead of across all years). This meant that if a country’s performance ranking among its comparison countries did not change, then a country could receive the same score across years. This would be true even if its performance in the raw data had changed across years. The new methodology corrects for this, so that we can assess not only relative distance between countries’ performance, but also distance between one country’s improvement upon its past performance. More information on the stress-testing process that took place to update the methodology, potential impacts on the data results, and literature supporting this revision can be found in the Appendix.
Figure 2: Summary of China Pathfinder clusters and indicators, 2023
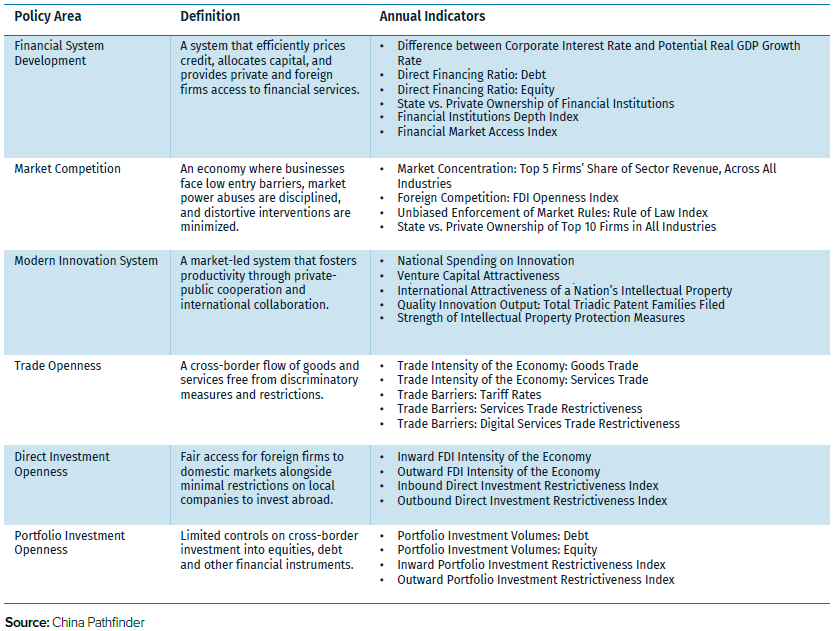
The annual indicators that contribute to each economic area’s composite score are outlined in Table 1, and are explained in more detail in Chapter 2.
The China Pathfinder framework also uses supplemental indicators, though these datapoints do not contribute to composite scoring. Supplemental indicators zero in on unique aspects of China’s economy that are not comparable across countries, such as the role of stock connects in opening up Chinese investment avenues. These indicators are updated annually and are featured at the end of the cluster analyses in Chapter 2.
Numbers alone are not sufficient to capture the complexity of a country’s economic system or how the domestic dimensions of economic policy interact with the external dimensions. Therefore, we supplement our quantitative analysis with qualitative assessments. In Chapter 2, the analysis of each cluster discusses composite scores, but also unpacks the developments that shaped policies— and outcomes—in 2022. Chapter 3 highlights the most significant data findings and draws conclusions about their potential impact on China and other economies. As this is the third report in a series of four annual reports, we outline the main signposts we expect to see in H2 2023 and 2024 that would indicate China is moving in a market reform direction.
Chapter 2: Historical baseline and 2022 stocktaking
In this chapter, we review each of our six clusters in detail. For each of the six economic pillars, we begin with a discussion of how to define the cluster and its relevance to a market-oriented economy. This provides a framework for how we selected indicators and why they are a fair proxy of that particular area of economic performance. The next section outlines each indicator and its corresponding methodology, followed by an analysis of the 2022 data findings for China and open-market economies. The individual indicator stocktaking leads to our overall composite score results, where we assess countries’ relative performance and interesting trends for 2010, 2020, 2021, and 2022. The six sections of this chapter each conclude with a review of the major policies and other relevant developments that were enacted or occurred in China in 2022.
2.1 Financial system development
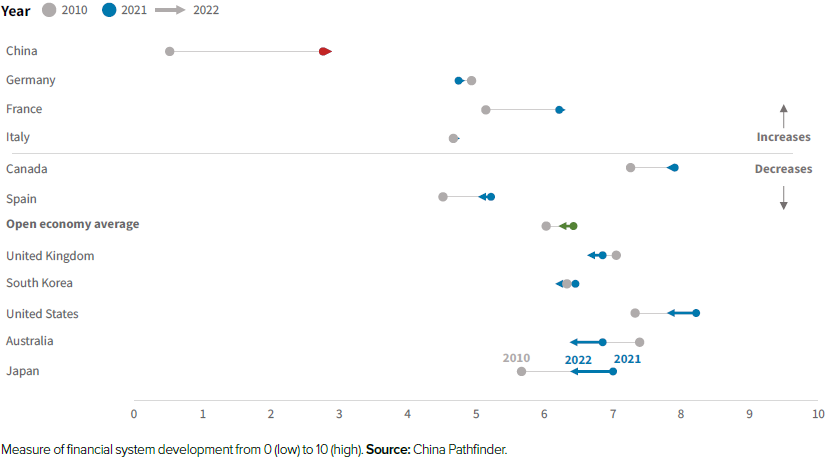
Figure 3: Composite index: Financial system development, 2022
Definition and relevance
Open market economies rely on modern financial systems for the efficient pricing of risk and allocation of capital.11William Hynes, Patrick Love, and Angela Stuart, eds., The Financial System (Paris: Organisation for Economic Co-operation and Development, 2020), https://doi.org/10.1787/d45f979e-en. Key pillars of modern financial systems are generally market-driven credit pricing, availability of a broad range of financial instruments, the absence of distortive administrative controls on credit price and quantity, and access for foreign firms to financial services and foreign exchange markets.
How does China stack up in 2022?
We chose the following annual indicators to benchmark China’s financial system development against that of open market economies.
Efficient pricing of credit
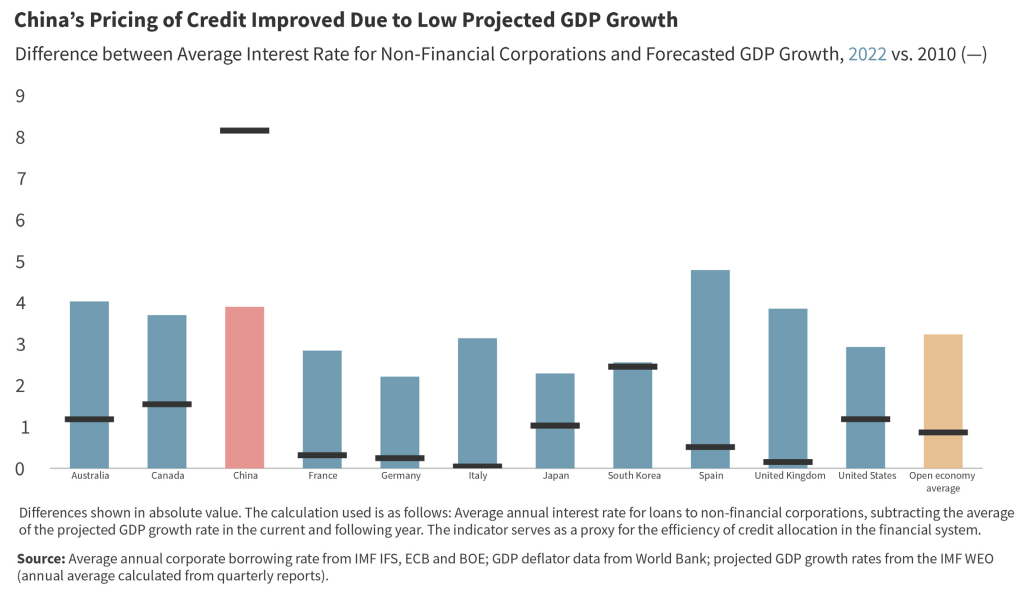
As a proxy for efficient pricing of credit we use the absolute value difference between the average borrowing rates for non-financial corporations and projected GDP growth. In an efficient financial system, the cost of capital (the average interest rate) should roughly mirror the expected return (for which we use the projected GDP growth rate). Countries with efficient pricing of credit will be close to zero in this calculation.
In 2010, China’s projected growth rate far exceeded the real interest rate for corporate borrowers, effectively subsidizing producers and punishing savers. While 2021 was characterized by high bounce-back growth rates associated with China’s pandemic recovery, China’s pricing of credit improved in 2022 because of rising real interest rates and slowing GDP growth. Meanwhile, in many open economies, high inflation rates far surpassed average borrowing rates in 2022, leading to large differences between the proxied cost of capital and expected return. China’s score for this indicator, 6.1 percent, has now entered the market economy range, which had not been the case in previous sampled years.
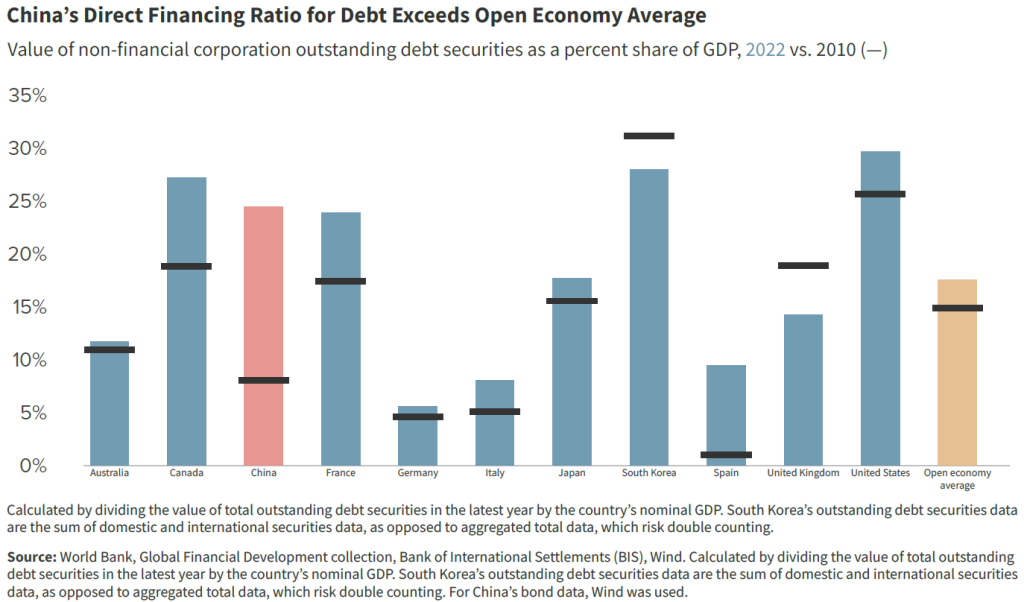
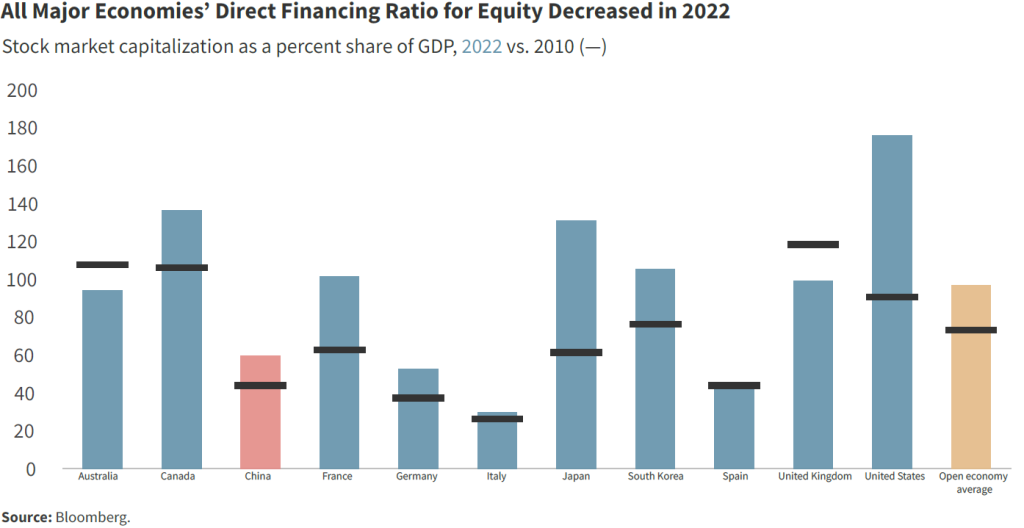
Direct financing
The extent of direct financing in an economy reflects the ability of firms to borrow directly from the market instead of going through banks and other intermediaries. We include two measures of direct financing: stock market capitalization as a share of GDP and outstanding non-financial corporation debt securities as a share of GDP. China’s stock market capitalization relative to its GDP is still far lower than most other major economies. The stock market capitalization for all countries in our sample declined between 2021 and 2022, reflecting rising inflation and deteriorating global stock market conditions. Though China’s direct debt financing increased from 8.4 percent in 2010, its nonfinancial corporate bonds as a share of GDP has decreased marginally each year since 2020. However, its 2022 value of 24.5 percent still exceeds the market economy average of 17.6 percent. China’s direct debt financing has far surpassed the bank-dominated financial systems in the EU.
State ownership in top ten financial institutions
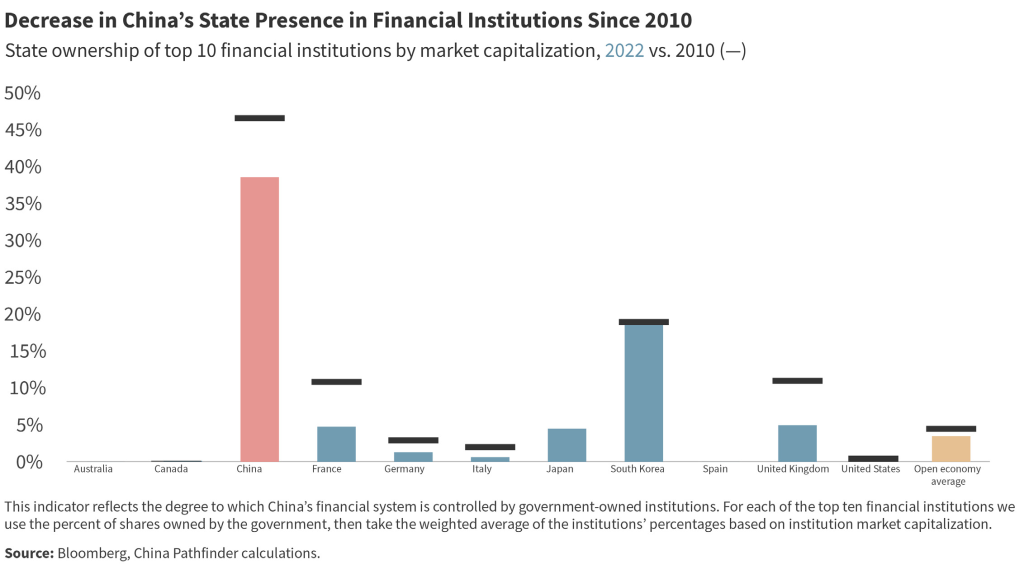
In previous years we relied on survey data from the World Bank’s Bank Regulation and Supervision Survey (BRSS) for information on state ownership in the financial sector. However, these surveys are not frequently updated, and were missing data for some of our sample countries. For this reason, we created our own indicator that captures the influence of the state in this area. Our indicator measures the degree of state ownership in the country’s top ten financial institutions by market capitalization. For each country, we look at the proportion of each institution’s public stock owned by the government. We then weigh the results according to each institution’s market capitalization. For this measure we relied on market capitalization and government ownership data provided by Bloomberg.
We see a sizable gap between China and OECD economies for this indicator. In 2022, China’s weighted average government ownership proportion reached 39 percent compared to the open-economy average of 4 percent. The government ownership proportion for China dropped from 47 percent in 2010 but has not changed much since 2020. South Korea is the only OECD economy with a relatively high percentage of state ownership in financial institutions, at 19 percent in 2022. The high degree of state involvement in finance has been, and remains, one of the core systemic differences between China’s system and that of open economies.
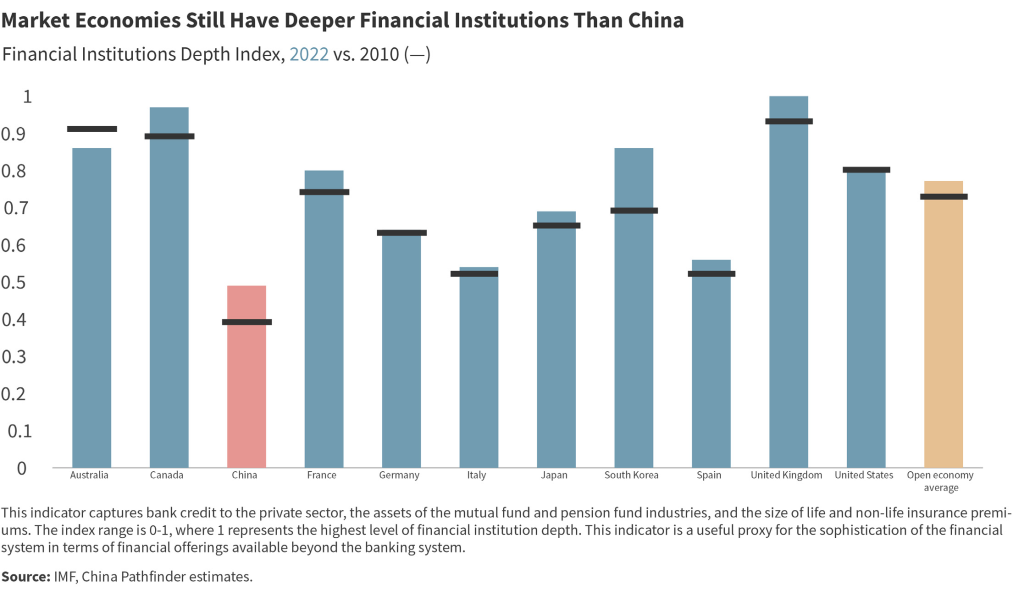
Financial institutions depth
The financial institutions depth indicator captures bank credit to the private sector, the assets of the mutual fund and pension fund industries, and the size of life and non-life insurance premiums to GDP. This indicator is a useful proxy for the sophistication of the financial system in terms of financial offerings available beyond the banking system, whereas other indicators of institutional depth often have bank credit as the only driver of the results. In 2022, China had the lowest score in the sample (0.49) but is close to Italy and Spain’s scores (0.54 and 0.56, respectively). However, China is still well behind the open economy average of 0.77.
Financial markets access
The financial markets access indicator illustrates the difficulties faced by smaller companies in accessing the stock market and captures the number of issuers in the bond market. It combines two variables: the percentage of market capitalization outside of the top ten largest companies as a proxy for access to stock markets and the number of financial and nonfinancial corporate issuers on the domestic and external debt market in a given year per 100,000 adults to estimate bond market access.
China is far behind the market economy average in this area, with access declining from 0.37 in 2021 to 0.19 in 2022. Its 2022 level of financial market access now is barely higher than it was in 2010, at 0.18. This could mean smaller Chinese firms faced rising difficulties accessing finance in 2022, or that large firms could borrow more easily. One contributing factor remains the financial institutions’ bias in favor of state-owned enterprises (SOEs), local government financing vehicles (LGFVs), and other state-affiliated actors. Because they enjoy the implicit backing of the Chinese government, they are assumed to be safer borrowers than small, private enterprises. Market economies’ financial market access has generally remained steady since 2020.
Composite score
Blending our annual indicators, our Financial System Development Composite Index puts China at 2.9 in 2022, against an average of 6.2 within our sample of the ten largest open market economies (Figure 3). This shows some improvement from China’s score of 2.8 in 2021. In 2010, China’s score was only 0.5, reflecting progress toward more depth and diversity in China’s financial system, as well as deleveraging efforts since 2018. However, China still has the lowest composite score among the countries in our sample for 2010, 2020, 2021, and 2022. For all indicators, China remains behind open economies. This is not necessarily surprising. China’s financial system is still largely driven by state-owned banks and has only recently moved towards more advanced forms of financing characteristic of market economies. While there has been some progress in ensuring that financing is available to a broader and more representative group of firms within the economy, the overall state-driven character of the country’s financial system remains unchanged.
Our indicator set has good coverage of the institutional dimensions of financial system development, but external factors have impacted the results for some indicators. For example, China’s pandemic recovery in 2022 affected GDP data, which is a component of some output-driven indicators. This contributes to the decline in market capitalization and nongovernment debt securities as a share of GDP for most countries in 2022.
A year in review: China’s 2022 financial system policies and developments
We update our benchmark indicators yearly to track the pace and direction of change. On a quarterly basis, we track policy developments that could push China either closer or further from the average of market economies in terms of its financial system. From this exercise, we have selected a few of the most significant events that took place in 2022.
China’s property sector troubles continued through 2022, prompting Beijing to take a series of temporary steps, such as the PBOC and CBIRC’s 16 measures to support the property market, that were more focused on stability than market liberalization. Instead of getting at the root of the problem, this policy package offered extensions for property developers to repay their outstanding bank loans and eased restrictions on bank lending to developers. This reinforces Beijing’s efforts to prop up the old growth model.
In April 2022, the PBOC revised the way it guides bank deposit rates, pricing deposits according to market interest rates instead of the central bank’s own benchmark rates. This change can reduce corporate lending rates and boost credit demand in the sluggish economy, representing an important step toward interest rate liberalization. China has attempted to initiate this reform numerous times since 2004, but has reversed its efforts each time to maintain the dominance of state banks. In 2012, the deposit rate was allowed to be set higher than the benchmark rate and by 2015, in theory, there was no ceiling on the deposit rate. In reality, the PBOC still managed deposit rates through an interest rate self-discipline committee to impose an implicit ceiling. During this time, the fastpaced development of wealth management products was a step toward market reform to allow unregulated competition on rates offered, replacing deposits. We will watch carefully to see further signals of interest rate liberalization.
Though in 2022, China’s government tuned down the rhetoric on the common prosperity campaign—which includes income inequality reduction as one of its pillars—it took aim at the perceived elitism and flashy lifestyles of financial sector employees. Chinese regulators aimed to restrict financial sector salaries, intervening in internal business decisions. In Q2 2022, the Securities Association of China warned companies in the sector against granting excessive short-term incentives for employees, citing compliance risks. In the same quarter, the Asset Management Association of China mandated that over 40 percent of senior staff bonuses be deferred for three years or more. The various interventions fall within a larger campaign to prioritize “social responsibility,” which signals increased government involvement in financial sector companies. The scrutiny on financial sector “extravagance” has intensified in 2023, with the Central Commission for Discipline and Inspection taking aim at high wages and bonuses.
In addition to tracking policy signals in these areas, we are also monitoring several higher-frequency indicators to gauge progress on market-oriented, liberal economic reforms. Figure 3.2 includes a selected number of these supplemental charts, including the pace of credit growth in the Chinese economy; the distribution of credit to consumers, the private sector, and SOEs; the distribution of Chinese bond ratings; interest rates for savers; and exchange rate dynamics.
Figure 3.1: Annual indicators: Financial system development (2022*)

2.2 Market competition
Figure 4: Composite index: Market competition, 2022
Definition and relevance
face low entry and exit barriers, market power abuses are disciplined, consumer interests are prioritized, and government participation in the marketplace is limited and governed by clear principles. Competitive markets are important to the overall development of an economy because firms with competitors have greater incentive to innovate and improve productivity. This adds diversity to the market and higher quality growth.
How does China stack up in 2022?
We chose the following annual indicators to benchmark China’s market competition against open market economies.
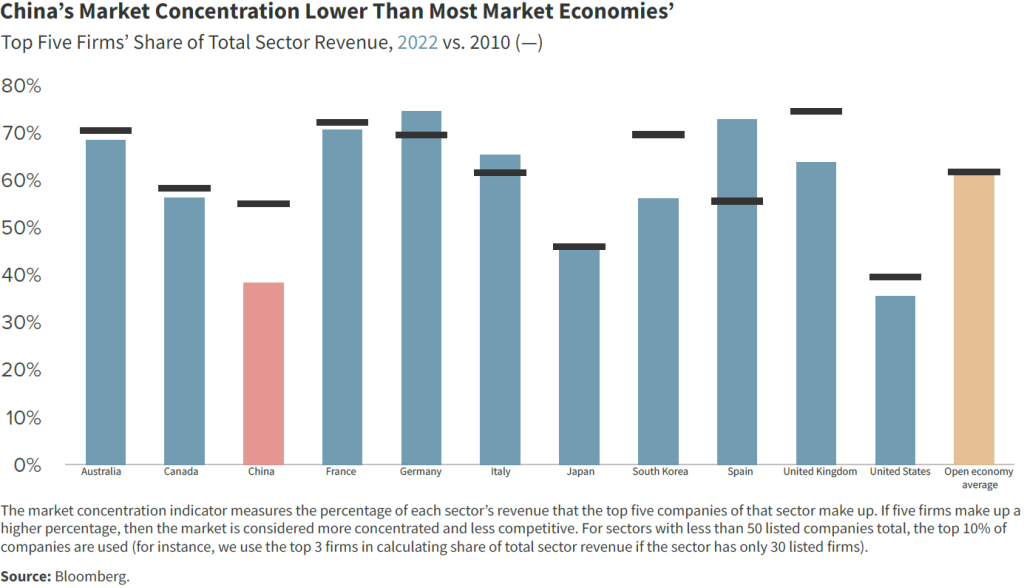
Market concentration
We measure overall market concentration across all industries using the top five listed companies’ revenue as a share of total industry revenue. The higher the proportion of total revenue that the five firms make up, the more concentrated the industry. The indicator is a simple average of the calculated proportions from 11 industries: communications, consumer discretionary, consumer staples, energy, financials, healthcare, industrials, materials, real estate, technology, and utilities. The industry categorization is consistent across all countries in the sample. For countries with industries comprising less than 50 listed companies, we use the top 10 percent of the total firms in the industry instead of the top five. The indicator was constructed in-house, based on manual data collection from Bloomberg, to replace the Herfindahl-Hirschman Index data published by the World Bank, which had a one-year lag.12“Methodologies to Measure Market Competition,” Organisation for Economic Co-operation and Development, June 11, 2021, https://oe.cd/mmmc.
This measure shows that China’s markets were less concentrated than most major open economies in 2022. China’s top firms across 11 industries represented only 38 percent of the industries’ total revenue in 2022, compared to 48 percent in 2021. By comparison, the OECD average was 61 percent. Most of the sample market economies in Europe saw an increase in market concentration from 2021 to 2022, with Italy as the exception. US markets, meanwhile, saw rising competitiveness, with top firms constituting 36 percent of industry revenue in 2022, down from 42 percent in 2021.
China’s size and large number of provinces likely contribute to its lower market concentration, as provincial monopolies competing with each other can produce an overall less-concentrated market. Economies of scale, which lead to lower production costs for larger companies, contribute to increasing market concentration for both capitalist and state-led systems.
This aggregate measure does not provide a fully nuanced perspective on the discrepancy between highly competitive sectors (mostly in manufacturing) and oligopolistic sectors with heavy state dominance in China (transportation and energy, among others). In some sectors, low market concentration scores indicate too much competition or, in other words, fragmentation. In instances where there are too many competing companies, inadequate capital discipline and government interference to prevent company failures lead to overcapacity that requires firms to cut corners on necessary investments or export aggressively to use idle capital assets.13Caroline Freund and Dario Sidhu, “WP 17-3 Global Competition and the Rise of China,” Peterson Institute for International Economics, February 2017. https://www.piie.com/sites/default/files/documents/wp17-3.pdf.
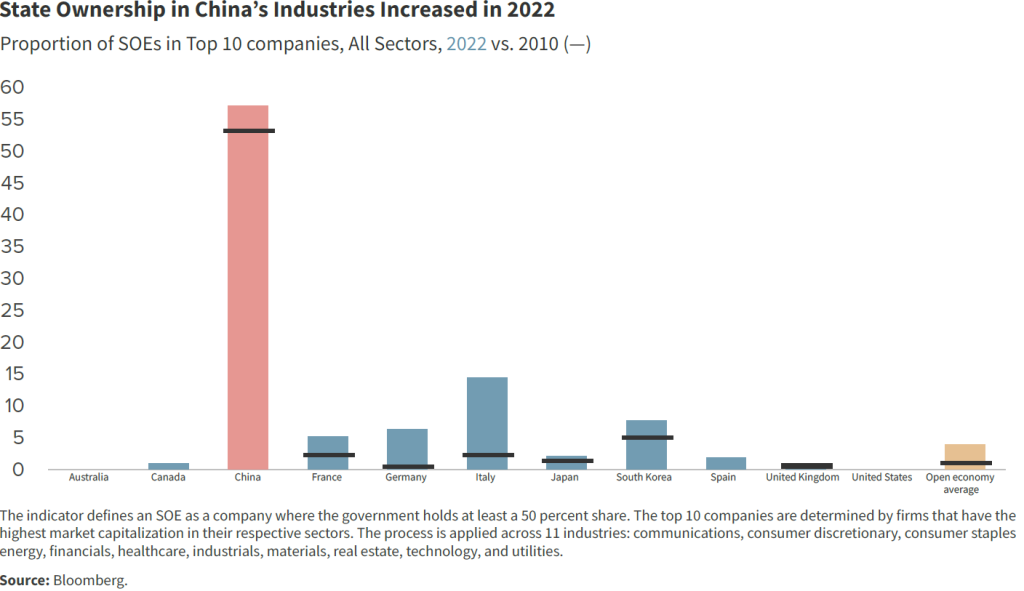
SOE presence in the top ten firms
One important determinant of market competition is the role of SOEs in the economy. We identify the top ten companies (based on market capitalization) in each of 11 industries. Companies for which the government holds at least a 50 percent share are considered state-owned. The market capitalization of SOEs’ in the top ten firms are added together, then divided by the industry top ten’s total market capitalization. This allows the results to proportionately account for SOEs that rank higher in the top ten by market capitalization, instead of simply counting how many SOEs are in the top ten list (which would treat each SOE as equally influential). The process is repeated for each of 11 industries listed in the market concentration indicator description.
Bloomberg data on government ownership share for companies in market economies accurately capture the extent of state ownership. For these countries, a company was considered an SOE if the government owned 50 percent or more of its shares. However, many Chinese SOEs’ largest shareholders are not clear-cut government entities such as the State-owned Assets Supervision and Administration Commission (SASAC) of the State Council or Ministry of Finance. The team used Chinese sources to conduct outside research on Chinese companies, determining whether companies had key shareholders that were other SOEs, the Central Huijin Investment Co. (a state-owned investment company), or Hong Kong Securities Clearing Company (of which the Hong Kong government is the largest shareholder). This supplemented the results that the Bloomberg ticker offered.
SOEs’ role in China’s economy is one of the key differences between the Chinese system and market economies. For China, SOEs made up 57.1 percent of top ten firms’ market capitalization across industries in 2022, an over 30 percent increase since 2021. In fact, the presence of SOEs in China in 2022 was even higher than in 2010, when they accounted for 53.6 percent. For 2022, in the financial, materials, and technology sectors, the number of SOEs within the top ten firms increased the most. In contrast, the open-economy average was only 3.9 percent. For all EU market economies in our sample, state ownership in top firms increased since 2021. Italy was the most notable example: Only 6.4 percent of its top ten firms were SOEs in 2021, increasing to 14.3 percent in 2022. For South Korea, the share of SOES’ market capitalization in the top ten firms’ market capitalization increased by more than 3 percentage points between 2021 and 2022, with the current proportion already exceeding 2010’s levels. By comparison, the US had no state ownership in the top ten firms across for all surveyed years, and the UK’s low proportion of 0.9 percent showed a further decline since 2021.
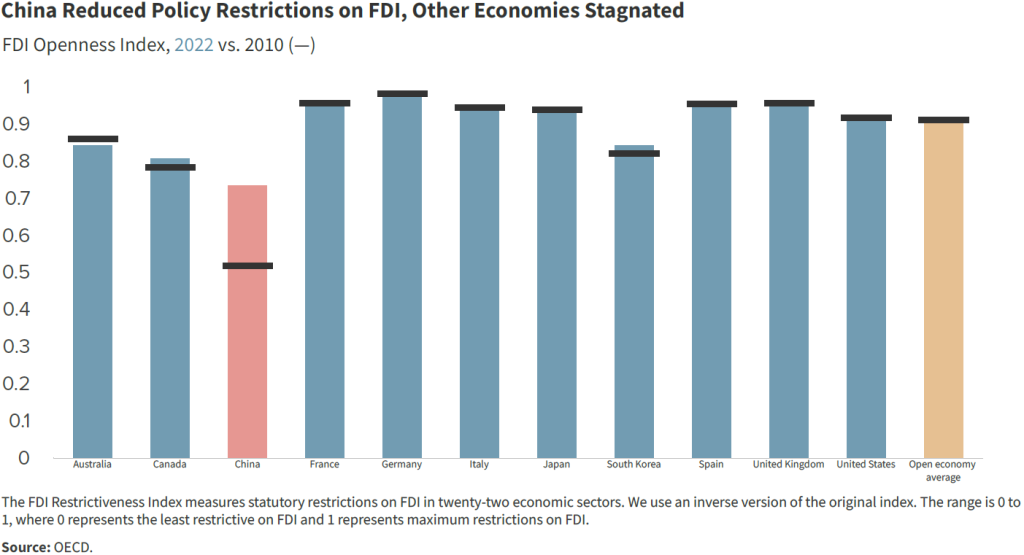
Foreign direct investment restrictiveness
Openness to competition from foreign companies is a characteristic of open market economies. The OECD’s FDI Regulatory Restrictiveness Index is an established indicator to measure the permissiveness of an economy to foreign competition.14Blanka Kalinova, Angel Palerm, and Stephen Thomsen, “OECD’s FDI Restrictiveness Index. 2010 Update,” OECD Working Papers on International Investment, No. 2010/03, Organisation for Economic Co-operation and Development, 2010, https://doi.org/10.1787/5km91p02zj7g-en. The index methodology is being revamped this year, so 2022 data are not available as of this publication. We use the OECD’s 2021 data as a basis to build our indicator after reviewing foreign equity restrictions, screening requirements, and other restrictions on the operation of foreign enterprises that were publicized in 2022. China scores 0.73 on an inverted scale from 0 (most restrictive) to 1 (least restrictive), compared to the open market-economy average of 0.92. In 2022, China showed further progress from its 2010 benchmark score of 0.53, although much of this progress was driven by changes in particular industries rather than by wholesale improvements across the economy. Its negative list for foreign investment remains extensive, as do the number of other measures handicapping foreign participants, including procurement and tech transfers. China’s FDI restrictions have worsened marginally since 2020. Market economies’ FDI restrictions have stayed largely the same since 2010. Compared to 2010 FDI restrictions levels, only Australia has increased restrictions in 2020 and then once again in 2021.
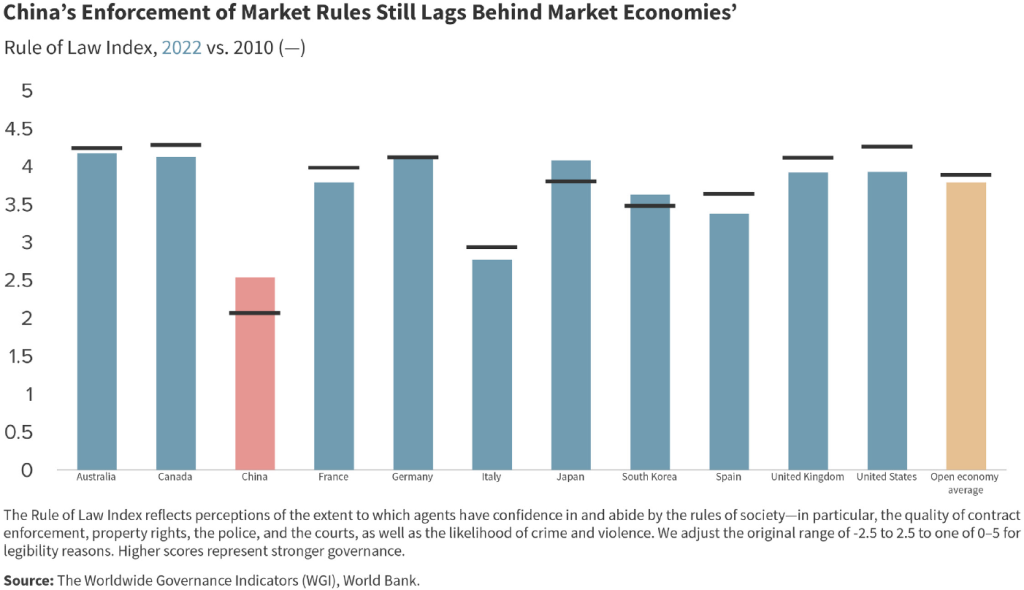
Rule of law
Another key ingredient for a competitive marketplace is fair and impartial enforcement of rules. The World Bank’s Rule of Law Index captures the extent to which agents have confidence in the rules of society, including elements such as the quality of contract enforcement, property rights, and the courts. Our adjusted index ranges from 0 to 5, with lower values representing less rule-of-law-based governance. Here China is behind all market economies, with a score of 2.5 compared to the open economy average of 3.8. There has been relatively little improvement for China since 2010 compared to other indicators.
Composite score
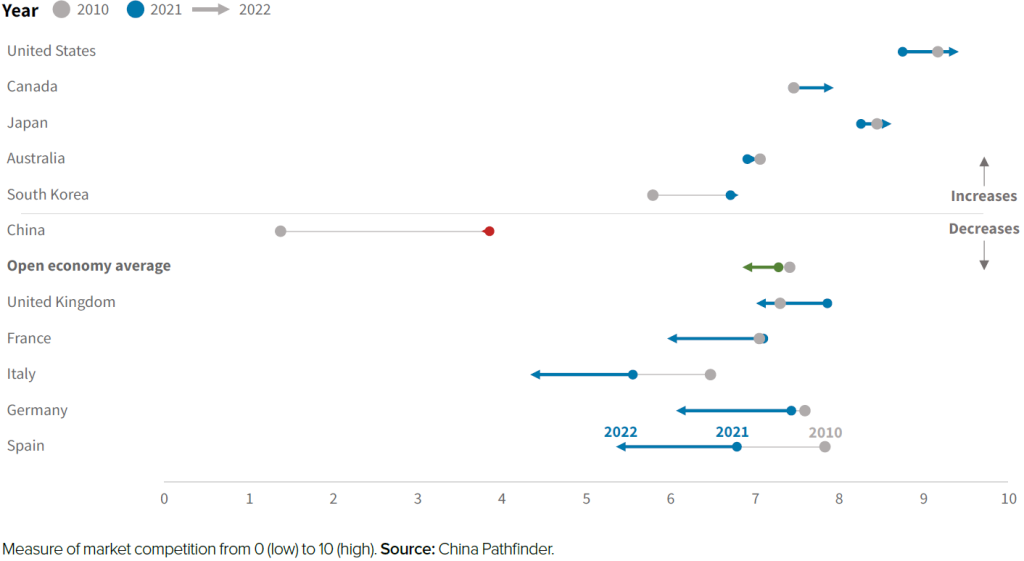
Our Market Competition Composite Index, which represents a normalized average of these annual indicators, puts China at 3.76 in 2022, against an open-economy average of 6.9 (Figure 4). This is a small decrease from its 2021 score of 3.83, though still well above the 2010 score of 1.4. China has competitive markets in many industries and oligopoly dominance in others, including via state ownership. Contestability of markets and fairness are diminished through limitations on rule of law. The goal of “competitive neutrality” in regulation of private and public-sector firms competing in the same segments—an aspiration at the heart of China’s 2001 World Trade Organization (WTO) accession—is still a distant one.
The composite scores show China’s market competitiveness still outside of the OECD economy range, but some of these economies slipped in a non-market direction in 2022 as well. Regression on the market competition metrics from 2010 to 2022 was notable for Italy and Spain, followed by Germany and France.
While our methodology captures many aspects of market competition, our data coverage does have some limitations. Cross-country data on the value and variety of subsidies is poor, especially in the case of China where the role of the state and non-market forces is murky and nearly impossible to research today. Measuring informal barriers to market competition—for example, discrimination against foreign and private companies, asymmetries in access to industrial policy, and the special role of Communist Party committees in firms—is notoriously difficult in China today.
A year in review: China’s 2022 market competition policies and developments
We update the abovementioned benchmark indicators yearly to track the pace and direction of change. On a quarterly basis, we track policy developments that could push China either closer or further from the average of market economies in terms of its competition policy. From this exercise, we have selected the three most significant developments that took place in 2022:
While Beijing promoted foreign investment in public announcements throughout 2022, Chinese regulators sent the opposite message by tightening rules surrounding cross-border data transfers when the information could pose a national security risk. Frustratingly for companies, China’s government has not defined what “national security” means. In May 2022, the Ministry of Commerce (MOFCOM) proposed draft regulations on dual-use15“Methodologies to Measure Market Competition,” OECD. “Methodologies to Measure Market Competition,” OECD. item export control, prohibiting exports that pose national security risks. Effective September 2022, the Cyberspace Administration of China (CAC) mandates security assessments for companies exporting sensitive or critical data. Definitions for data categories, including what exactly constitutes “important data,” remain unclear. These evolving regulations increase compliance challenges for foreign firms operating in China, particularly in reconciling these requirements with their home governments’ standards.
Our data shows that state presence in top companies across industries increased significantly in 2022. This does not account for the less clear-cut mechanisms for the Chinese government to intervene in business operations. In 2022, the China Securities Regulatory Commission (CSRC) updated regulations for publicly offered investment funds, mandating Communist Party cells be established in the Chinese subsidiaries of foreign fund managers and foreign Chinese joint ventures. While the influence of Party cells is unclear, their existence for foreign firms implies potential consultation with Party members for decisions, increasing the risk of government involvement.
Beijing’s strategy in reaction to economic troubles has not changed much, with industrial policy being a common tactic used to selectively boost consumption in certain sectors. In 2022, purchase tax exemptions on new energy vehicles (NEVs) were extended for the third time, now slated to end in 2023. Though the intervention was effective in doubling domestic NEV sales compared to 2021, it came at the expense of the broader auto industry, where traditional car sales contracted by 13 percent in 2022. Favoring specific industries remains a pillar of China’s industrial policy, warping outcomes and creating perverse incentives.
In addition to a preference for state guidance in setting economic outcomes, it also shows a continued supply-side bias, whereas direct support to China’s consumers would be more helpful to rebalance the economy. In addition to tracking policy developments, we are also watching higher-frequency indicators to gauge real-time progress on market- oriented and liberal economic reforms. These include more granular measures of state ownership in the Chinese economy (such as monthly profits and employment by ownership type and SOE return on assets), and FDI restrictions by sector (Figure 4.2).15
2.3 Modern innovation system
Figure 5: Composite index: Modern innovation system, 2022
Definition and relevance
Market economies rely on innovation to drive competition, increase productivity, and create wealth. Innovation system designs vary across countries, but market economies generally employ systems that rely on government funding for basic research but emphasize private sector investment; encourage the commercial application of knowledge through the strong protection of intellectual property rights; and encourage collaboration with and participation of foreign firms and researchers, except in defense-relevant technologies
How does China stack up in 2022?
In 2023, questions about the reliability of China’s R&D statistics prompted the OECD to put a handful of their Main Science and Technology Indicators on hold.16OECD’s primary data concern was China reporting a 10 percent increase in total business expenditure on R&D between 2019 and 2020, though business expenditure in manufacturing sectors decreased by 1 percent. This would mean a 99 percent year-over-year increase for the remaining sectors, which is unlikely and for which Chinese authorities did not provide additional detail to the OECD. This means that one of the annual indicators—the ratio of private enterprise to government expenditure on R&D—was excised from the China Pathfinder framework to preserve the integrity of the analysis. As a result, for each year in the sample we recalculated all countries’ composite scores without this indicator and stress-tested the results to ensure changes in scores were marginal.
We chose the following annual indicators (also used in previous China Pathfinder reports) to benchmark China’s track record against open market economies in terms of a modern innovation system.
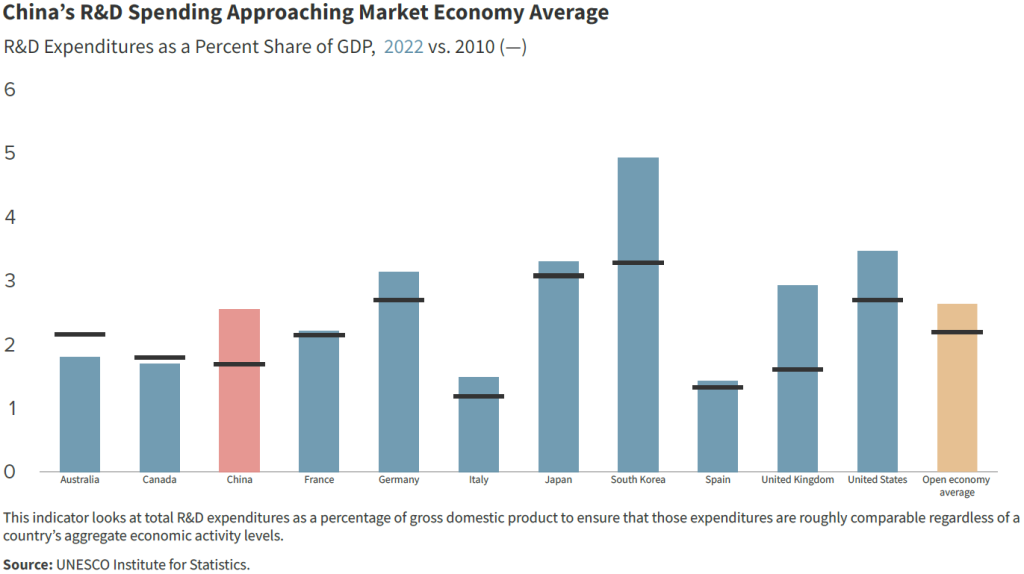
National spending on research and development
R&D expenditures as a percentage share of GDP is an indicator to measure R&D spending relative to comprehensive economic activity across the economies in our sample. Our data show that China has modestly increased its relative R&D spending each year since 2020, from 2.2 percent to 2.4 percent in 2021, and to 2.55 percent in 2022. China is now approaching the open-economy average of 2.64 percent. However, its spending on R&D as a share of GDP remains significantly below high-tech powerhouses such as South Korea, the United States, Japan, and Germany. Notably, these market economies also experienced the highest increases in R&D spending as a share of their GDPs since 2010. For instance, South Korea’s R&D spending had increased nearly 50 percent, from 3.3 percent in 2010 to 4.9 percent in 2022. Most of this increase happened between 2020 and 2021, amidst increasing competition in high-tech sectors globally. This year South Korea’s government announced it would allocate 70 percent of its R&D budget to core tech, including secondary batteries and semiconductors. High R&D spending does not always lead to innovation: modest commercial aviation headway in China, despite huge development spending over the past twenty years, is an example of that.
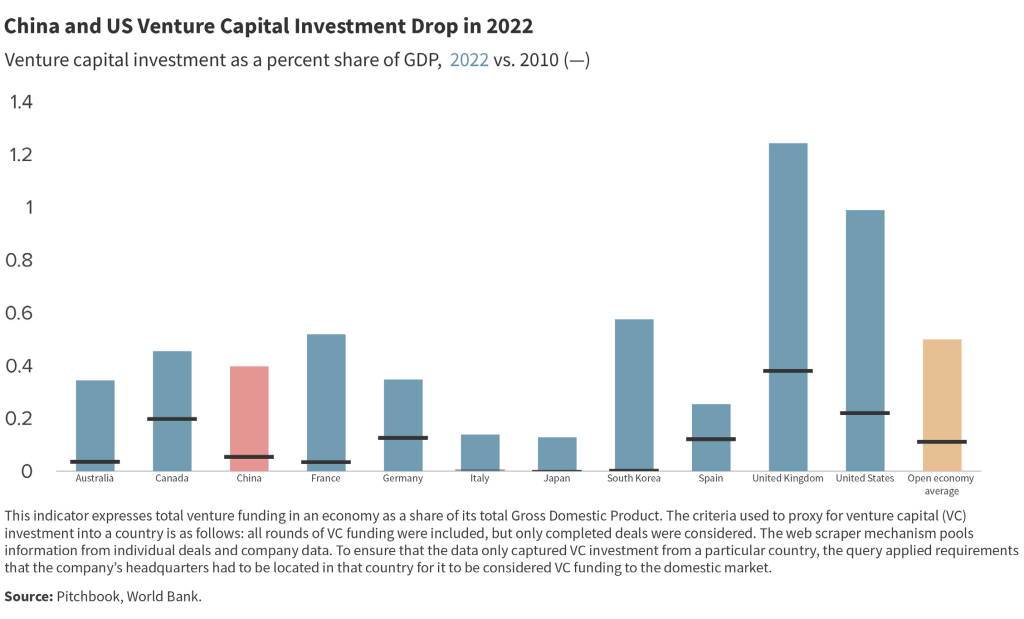
Venture capital attractiveness
Venture capital investment as a share of GDP is our second reflection of system innovativeness. Venture capital plays a key role in innovation-driven entrepreneurship and shows the confidence of private sector investors in start-ups’ ability to grow in an economy’s ability.17Tristan L. Botelho, Daniel Fehder, and Yael Hochberg, “Innovation-Driven Entrepreneurship,” Working Paper 28990, National Bureau of Economic Research, 2021, https://www.nber.org/papers/w28990.
The United States has long dominated global venture capital, but its VC as a share of GDP dropped from 1.5 percent in 2021 to under 1 percent in 2022. The United Kingdom took the lead with 1.24 percent in 2022. While China has been one of the most important new recipients of global venture financing, its VC as a share of GDP in 2022 dropped lower than its 2020 and 2021 levels, coming in at 0.4 percent. In our 2022 annual report, we anticipated that the crackdown on technology firms—which has continued in the financial sector—and overseas IPOs would reduce enthusiasm of private and foreign investors for Chinese startups. The disappointing 2022 data has captured these impacts. While state investment remains a major driver of VC in China through government guidance funds and similar vehicles, US pressure related to semiconductors and other national security-linked industries contributes to the waning enthusiasm.
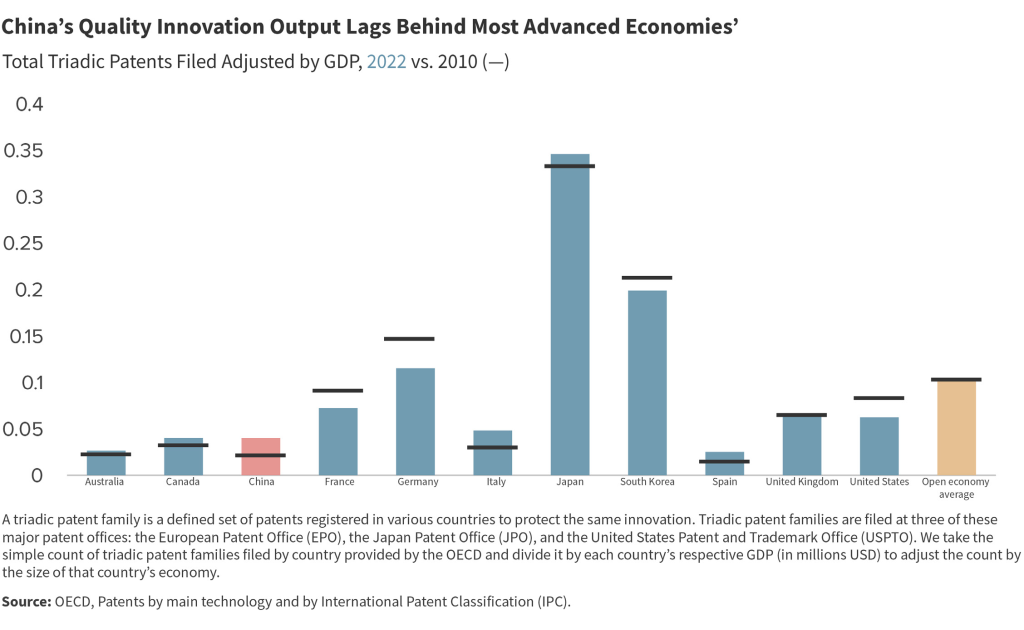
Triadic patent families
Filed As an indicator for the quality of innovation output, we use the number of triadic patent families filed, controlled for GDP. Triadic patent families are corresponding patents filed at the European Patent Office, the United States Patent and Trademark Office, and the Japan Patent Office. They are generally considered higher quality patents and, thus, offer a better perspective than purely looking at the number of patents. China filed roughly 300 more triadic patent families in 2022 compared to 2021, but the progress is incremental compared to South Korea, which filed nearly 700 more patents in 2022 relative to 2021. China’s innovative quality, as measured by this indicator, falls below the open-economy average of 4,400 patents, which contrasts sharply with China’s top global position in the count of overall patents filed.18Due to China’s system that rewards patent filing, and the resulting overreporting of patent numbers to meet policy targets, the high number of patents is often not considered an accurate representation of quality innovation. Most of China’s patent registrations are utility model patents, which tend to be less innovative and lower quality.
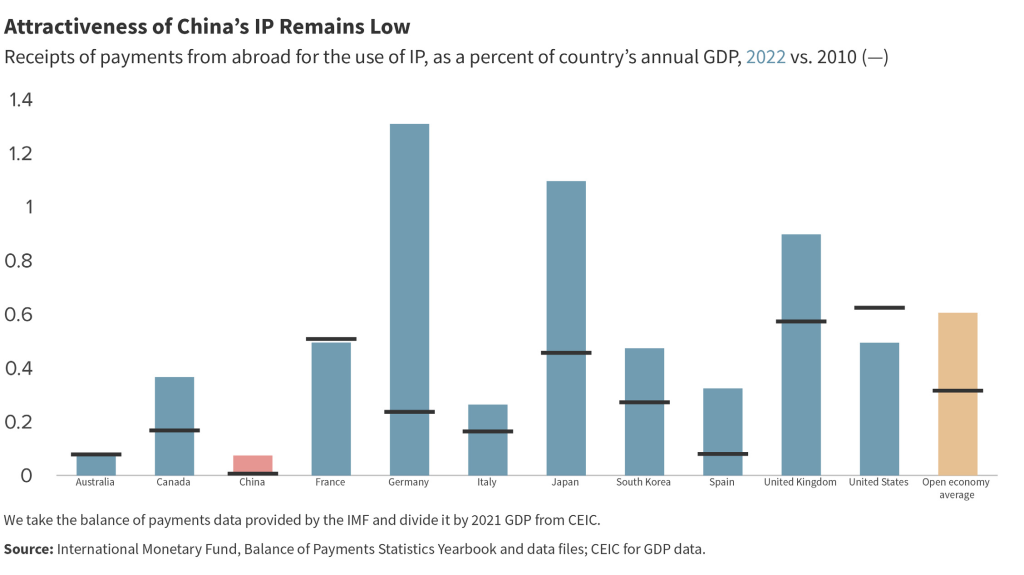
International attractiveness of a nation’s intellectual property
Another proxy for a country’s innovation output quality and global relevance is receipts for payments from abroad for the use of intellectual property (IP). Controlled for GDP, this indicator offers perspective on the relative attractiveness of national IP to other nations.19One caveat for this indicator is that some of the input data may be subject to distortions from international tax optimization practices and balance-of-payments data quality problems. China ranked last in this indicator for 2010, 2020, and 2021, but saw an incremental improvement in 2022. At 0.074 percent of GDP, China’s receipts for IP surpassed Australia’s (0.073 percent of GDP). The open economy average was 0.6 percent, indicating Chinese companies have some catching up to do. While Germany still led in receipts for IP as a share of GDP in 2022, Japan is catching up, seeing a 12.3 percent increase from 2021. Receipts for the United States’ IP decreased 9 percent in 2022 compared to 2021.
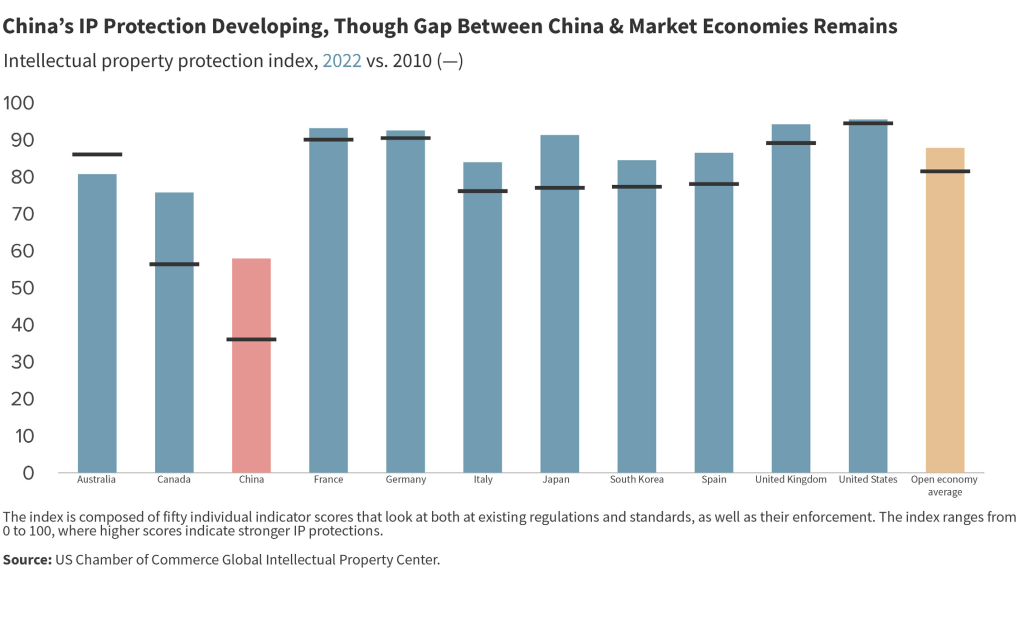
Strength of IP protection regime
To measure the protection of intellectual property, we use the International Intellectual Property Index provided by the US Chamber of Commerce’s Global Innovation Policy Center. The index is composed of fifty individual indicator scores that look at both existing regulations and standards, as well as their enforcement. Because the index was not launched until 2012, we use that year as our baseline. China has a score of 58 in 2022, a 2-point improvement since 2021, but well below the open-economy average of 87.8. However, China has shown considerable improvement from its 2012 baseline, when it had a score of 37. This long-run improvement reflects China’s efforts to strengthen de jure protections and establish more reliable legal enforcement mechanisms. Since 2020, all market economies have seen little change in scores.
Composite score
Combining the above indicators, our Modern Innovation System Composite Index puts China at 2.18 in 2022, against an average of 4.5 within our sample of the ten largest open market economies (Figure 5). China has made progress toward a modern innovation system since 2010, when it scored 0.38, but it still suffers from substantial institutional shortcomings (from heavy state intervention to lagging IP protection) and shows a substantial gap in innovation quality. China’s 2022 composite score also declined from the 2.38 that it received in 2021. While some market economies have seen falling scores from 2021 to 2022, all of them have still improved compared to 2020.
Countries’ drop in venture capital as a share of GDP accounted for most of the composite score decreases between 2021 and 2022. The wide range of composite scores even among market economies from 2010 to 2022 indicates that a market-driven “modern innovation system” can take many shapes and forms. Market economies have generally opened their innovation systems more in recent years compared to 2010, as well as upgrading innovation regimes on the basic research side, through R&D expenditures, triadic patents, and IP protections.
Our analysis has some limitations. For example, it does not include certain unique aspects of China’s economy, like the presence of SOEs in leading sectors relevant to innovation including telecommunications, airspace, biotech, and semiconductors. Data constraints also restrict our insight into specific components of China’s innovation ecosystem, such as subsidies or government guidance funds.
A year in review: China’s 2022 innovation policies and developments
We update these benchmark indicators yearly to track the pace and direction of change. On a quarterly basis, we track policy developments that could push China either closer or further from the average of market economies in terms of its innovation system. From this exercise, we have selected the most significant developments that took place in 2022, all of which are steps to regulate or centralize data:
In 2022, CAC announced rules governing how tech companies use algorithms, to prevent the spread of harmful or illegal information online. The policy created a registration system, where companies or individuals developing algorithms must submit paperwork to CAC for each creation. The regulator could opt to conduct security checks on the algorithms if deemed necessary. While the rules help to establish standards and can put a stop to companies’ algorithm abuses that have facilitated unfair competition or monopoly behavior, they also give the government leeway in defining “fake news” or “harmful information.” This can further enable the state to integrate ideological guidance into how online information or app content is generated.
CAC is scrambling to set up guardrails in this rapidly developing digital space, with the algorithm rules being followed by 2023 draft regulations on AI-generated content (AIGC). Efforts to regulate harmful content are not exclusive to China, but there, regulation extends to censoring government criticism. These rules could hinder sector growth and disadvantage Chinese AIGC providers against competitors like OpenAI’s ChatGPT. CAC-mandated registration and security reviews would apply not just to algorithms but also to GPT training content. China’s data opacity, exemplified by unreliable R&D expenditure reports, complicates foreign economic analysis. Actions in 2022, like CAC’s cybersecurity probe into academic database CNKI, further restricted foreign access to key information. The cybersecurity review focused on CNKI’s management of data on Chinese key industries, research projects, and S&T development. This growing data sensitivity could undermine China’s basic R&D efforts including by making foreign companies or academics fearful of inadvertently violating the cross-border data rules or being unable to transfer their own data out of the country.
In addition to tracking policy developments, we are also watching several higher-frequency, and often China-specific, indicators to gauge progress on market-oriented and liberal economic reforms. Figure 5.2 shows a selection of these indicators including the number of researchers per one thousand people employed, the share of foreign investors in venture funding rounds for Chinese companies, payments for the use of intellectual property, and the innovative industry share in industrial value added.
Figure 5.1: Annual indicators: Modern innovation system (2022*)
2.4 Trade openness
Figure 6: Composite index: Trade openness, 2022
Definition and relevance
Free trade is a key feature of open market economies to facilitate specialization based on comparative advantage. We define trade openness as cross-border flow of market-priced goods and services free from discriminatory, excessively burdensome, or restrictive measures.20Halit Yanikkaya, “Trade Openness and Economic Growth: A Cross-Country Empirical Investigation,” Journal of Development Economics 72 (1): 57–89, https://doi.org/10.1016/s0304-3878(03)00068-3.
How does China stack up in 2022?
We apply the following annual indicators to benchmark China against open market economies in terms of trade openness.
Goods and services trade intensity
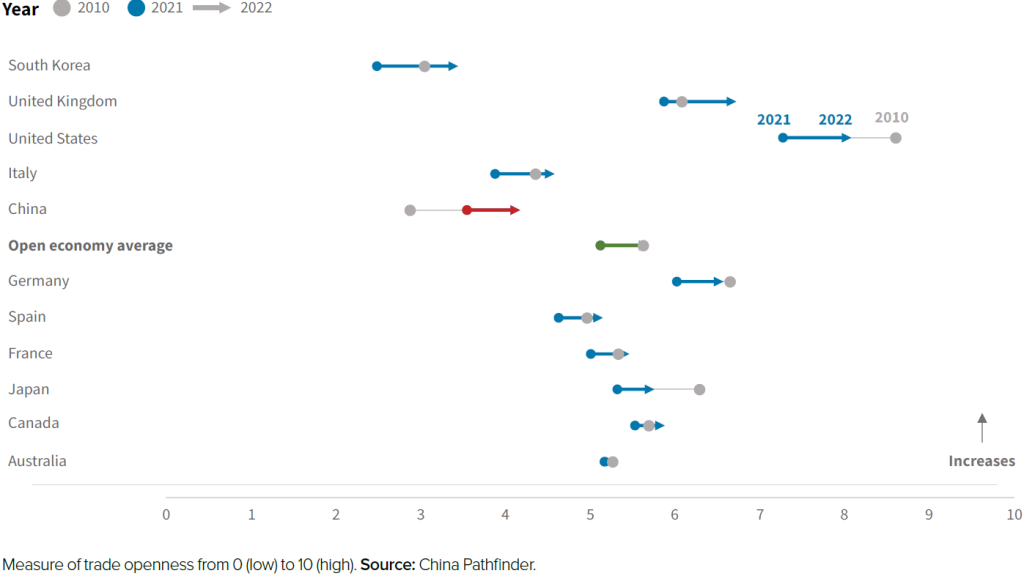
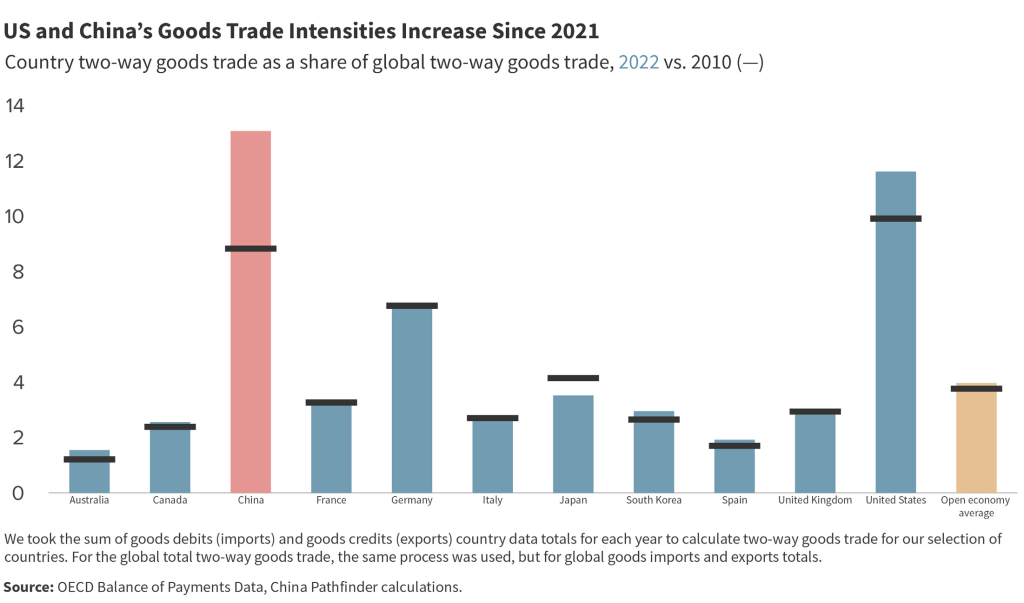
Our primary de facto trade openness indicators are gross two-way goods trade as a share of global two-way goods trade and gross two-way services trade as a share of global two-way services trade. This metric is often referred to as the trade openness ratio, although a low ratio doesn’t necessarily imply restrictive policies (it can also derive from the size of a country’s economy or a non-trade-friendly geographic location). Both indicators show that China is an economy heavily integrated in global trade flows. China has the highest ratio when it comes to goods trade and a ratio above the open-economy average when it comes to services trade. China’s goods trade intensity increased from 12.5 percent in 2021 to 13.1 percent in 2022. The United States’ goods trade intensity increased from 9.8 percent to 11.6 percent—an 18 percent jump— over the same period. Other market economies saw only marginal improvement.
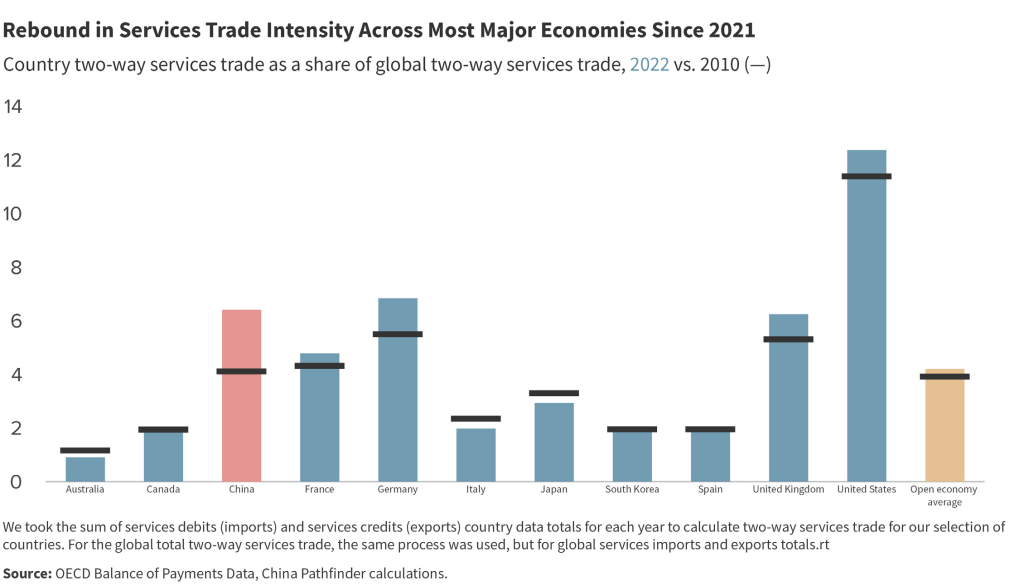
In 2022, global services trade rebounded across most market economies, following a decline in 2020-2021. The US leapt even further ahead in services than goods trade compared to the previous couple of years. Its 2022 share of global two-way services trade increased 26 percent from 9.8 percent in 2021, now making up 12.4 percent of the world’s two-way services trade. In 2022, China’s services trade intensity increased to 6.4 percent, up from 5.8 in 2021. Germany’s services trade intensity recovered since 2021, surpassing China’s to hold the second-largest share, at 6.8 percent.
Trade Barriers: Tariff Rates
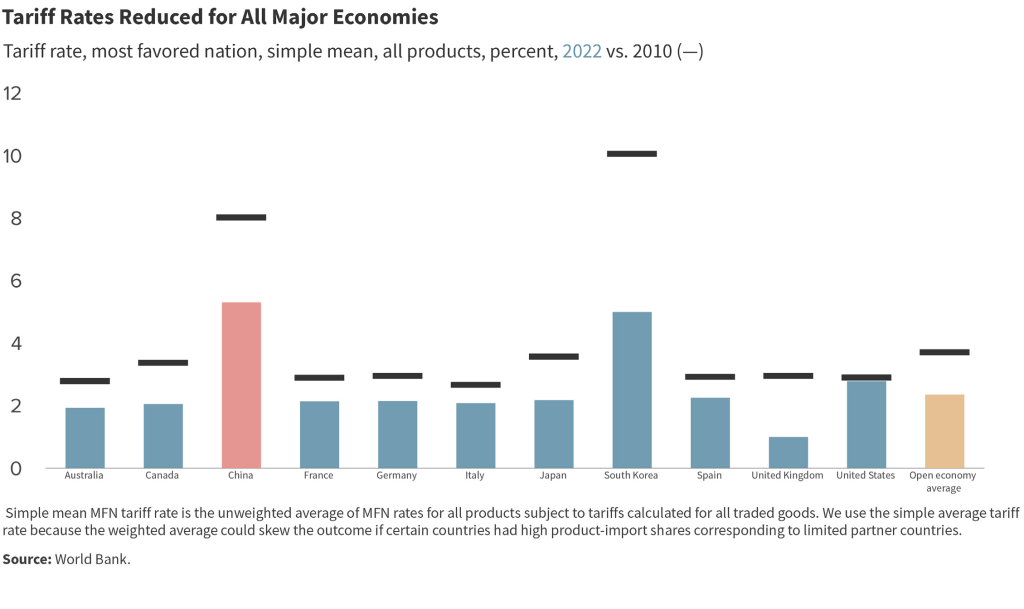
On the de jure side, the standard metric for assessing a country’s trade openness is tariff rates. We chose the simple mean of most favored nation (MFN) tariff rates across all product categories. We use a simple mean instead of an average that applies weight by the product import shares corresponding to each partner country. The simple mean can diminish the common issue of weighted MFN tariff rates being skewed downward, as goods subjected to steep tariffs would likely see lower quantities imported and, thus, a lower weight in the calculation.21Chad P. Bown and Douglas A. Irwin, “What Might a Trump Withdrawal from the World Trade Organization Mean for US Tariffs?” Policy Briefs 18-23, Peterson Institute for International Economics, November 2018, https://www.piie.com/publications/policy-briefs/what-might-trump-withdrawal-world-trade-organization-mean-us-tariffs. In 2022, China’s tariff rate was still higher than that of market economies, but it dropped by 2.26 percentage points since 2021. All sampled countries reduced their tariff rates over the same period.
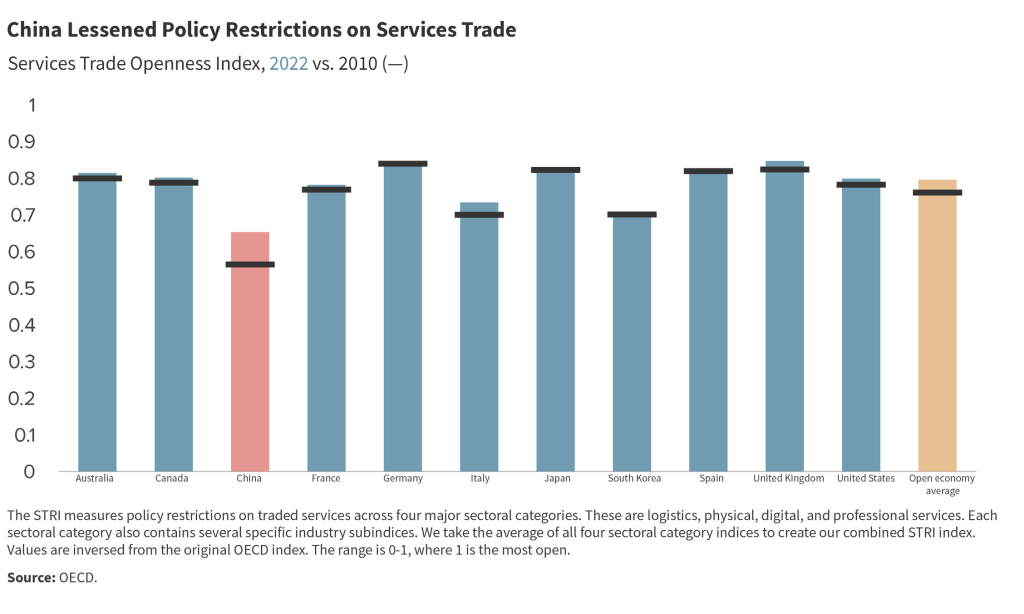
Restrictions on services trade
For a de jure measure for services trade openness, we rely on the OECD’s Services Trade Restrictiveness Index (STRI), which measures policy restrictions on traded services across four major sectoral categories.22“OECD Services Trade Restrictiveness Index: Policy Trends up to 2020,” Organisation for Economic Co-operation and Development, February 2021, https://www.oecd.org/trade/topics/services-trade/documents/oecd-stri-policy-trends-2021.pdf. These are logistics, physical, digital, and professional services, and we weight them equally. Each sectoral category also contains several specific industry subindices. A lower score on the index indicates a more open policy to services trade, with scores ranging from 0 to 1. This index only started to provide data in 2014, so this is the earliest year for benchmark comparison. In 2022, China’s score was 0.35, more restrictive to services trade than the open-economy average of 0.20.23“OECD Services Trade Restrictiveness Index (STRI): China – 2021,” Organisation for Economic Co-operation and Development, https://www.oecd.org/trade/topics/services-trade/documents/oecd-stri-country-note-chn.pdf. While China eased some restrictions compared to 2021, sectors such as accounting, media, and telecom remain highly restricted. Meanwhile, OECD economies have maintained consistent services trade openness since 2014.
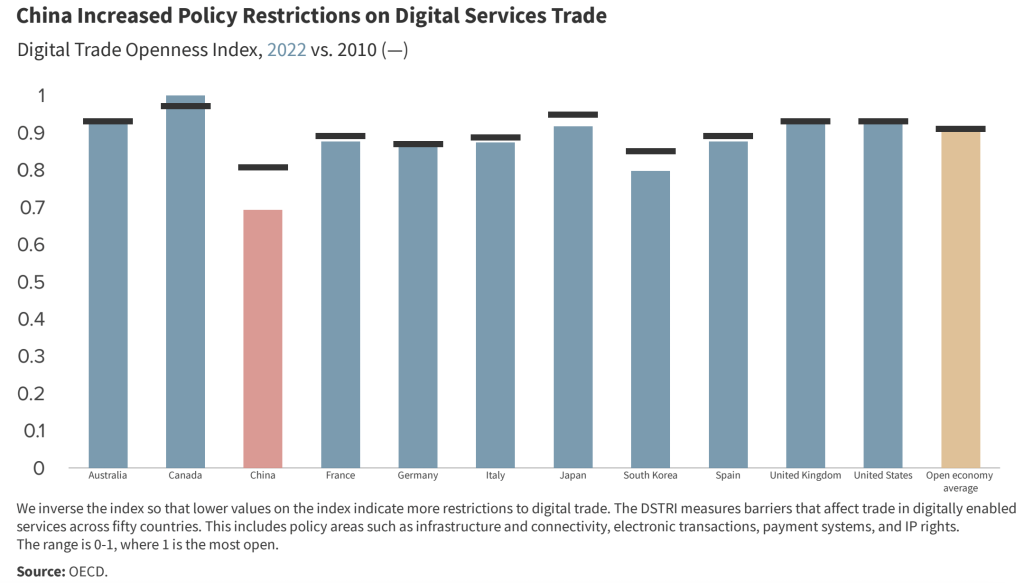
Restrictions on digital services trade
In recent years, China has become an even greater outlier in digital services trade, a crucial subcategory of global services trade. This research adapts the OECD’s Digital Services Trade Restrictiveness Index (DSTRI), which measures barriers that affect trade in digitally enabled services across fifty countries.24Janos Ferencz, “The OECD Digital Services Trade Restrictiveness Index,” OECD Trade Policy Papers No. 221, OECD Publishing, 2019, https://doi.org/10.1787/16ed2d78-en. This includes infrastructure and connectivity, electronic transactions, payment systems, and IP rights. The index ranges from 0 to 1, with higher scores indicating a greater degree of restrictiveness. This index only started to provide data in 2014, so this is the earliest year for all countries in our sample. In 2022, China’s DSTRI score was 0.31, the same as in 2021, but still above the open-economy average of 0.10. China’s DSTRI score was 0.19 in 2010, showing that restrictions have increased since. The lowest-ranked market economy in our sample, South Korea, had a score of 0.2, and China’s restrictions were within open-economy range in 2010, though ramping up since then. The scores for most market economies have remained consistent since the index’s inception in 2014, offering a reliable benchmark for comparison.
Composite score
In 2022, China’s Trade Openness Composite Index score—which reflects a blended average of the above indicators—was 4.12, up from 3.55 in 2021 and significantly higher than its 2010 score of 2.88. This improvement primarily stems from de facto indicators and brings China closer to the open-economy average of 5.7 (Figure 6). In fact, this is China’s best overall score in the six clusters we measure. Composite scores for market economies also increased over the same period for the same reason. While China has reduced tariffs to a level nearly comparable with OECD economies and has become the world’s largest trading nation in goods, it remains less open in services trade and faces criticism for unreported nontariff barriers.
While we have good access to basic trade-related data, our coverage faces several shortcomings. For instance, the services trade data have flaws, including significant distortions through tourism spending and hot money flows. The pandemic years’ impact on tourism can produce skewed results for services trade data. Many aspects of China’s trade environment that are not unique to China— including nontariff barriers, informal discrimination, and exchange rate interventions—are especially difficult to research in China due to restrictions on research, data access limitations and other problems.
A year in review: China’s 2022 trade policies and developments
We update these benchmark indicators yearly to track the pace and direction of change. On a quarterly basis, we track policy developments that could push China either closer or further from the average of market economies in terms of its trade openness. From this exercise, we have selected the two most significant developments that took place in 2022:
In August 2022, Beijing imposed retaliatory trade measures against Taiwan in response to a visit by Nancy Pelosi, then-US House Speaker. China’s General Administration of Customs banned imports of Taiwanese foods, including biscuits and fruits, while MOFCOM suspended exports to Taiwan of natural sand, an input in semiconductor manufacturing. However, these actions had limited strategic or economic impact on bilateral trade due to the minor role these sectors play in Taiwan’s exports and China’s exports to Taiwan.
In late 2022, China’s State Council announced a marginal tariff reduction for 2023, lowering the general tariff rate from 7.4 to 7.3 percent. The policy temporarily reduced tariffs on over one thousand products and signaled further cuts for some IT products starting in July 2023. While framed as a trade liberalization move, the tariff adjustments primarily aim to boost lagging growth. The State Council pointed to supporting consumption and the manufacturing sector as the main reasons for lowering tariff rates, which should push down the prices of certain medical supplies and drugs, food items, small household appliances, and inputs in advanced manufacturing. At the same time, this policy increased import and export tariffs on specific commodities to bolster the security of domestic industrial chains.
In addition to tracking policy developments, we are also watching higher-frequency, often China-specific, indicators to gauge real-time progress on market-oriented and liberal economic reforms. Figure 6.2 shows these indicators, including China’s current account balance as a share of GDP, RMB exchange rates compared to major currencies, China’s trade balances, role in processing trade, and trade policy interventions.
Figure 6.1: Annual indicators: Trade openness (2022*)
2.5 Direct investment openness
Figure 7: Composite index: Direct investment openness, 2022
Definition and relevance
Direct investment openness refers to fair, nondiscriminatory access for foreign firms to domestic markets and freedom for local companies to invest abroad without restrictions or political mandates. Direct investment openness is a key feature of open market economies that encourages competitive markets and facilitates the global division of labor based on comparative advantage.
How does China stack up in 2022?
We use the following annual indicators to benchmark China against open market economies in terms of direct investment openness.
FDI intensity
Our main de facto indicator for inbound direct investment is the inbound FDI intensity of the economy, which is calculated by dividing the total inbound FDI stock of an economy by its GDP. In 2022, China’s inbound FDI intensity stood at 19.1 percent of GDP, below the market economy average of 40 percent but higher than South Korea’s or Japan’s (14.1 percent and 4.8 percent, respectively). This score marks a decline for China since 2021, and places it even further below its 2010 level (which was 25.8 percent). For most open market economies, inbound FDI intensity has increased over the same duration. The market economy average increased more than ten percentage points since 2010.
For outflows, we measure outbound FDI intensity, which is calculated by dividing outward FDI stock by GDP. China’s outbound FDI intensity has improved from a very low base in 2010 but, with a score of 15.26 percent in 2022, it remains lower than any other country in our sample and the open economy average of 47 percent. China’s outbound FDI stock as a share of GDP decreased slightly from 2021’s 15.3 percentage. Most open market economies’ outbound FDI intensity either stagnated or declined since 2021. For the United States, the nearly 25 percent drop from 2021 to 2022 has brought its outbound FDI intensity to approximately match 2010 levels (equivalent to 32.1 percent of GDP). This indicator uses market value for FDI stock, which is subject to fluctuation. In 2020 and 2021, high equity valuations increased the market value for both inbound and outbound FDI stock, and the subsequent correction in 2022 pushed the values down. This contributed to the large drop in US inbound and outbound FDI intensity from 2021 to 2022.
Direct investment restrictiveness
To measure de jure restrictiveness for FDI, we built our own indicator for direct investment restrictiveness. While there is a solid body of academic work on the topic of cross-border capital controls, we found existing research insufficient for our purposes due to lackof a magnitude metric,25Andrés Fernández et al., “Capital Control Measures: A New Dataset,” IMF Economic Review 64 (2016): 548–574, https://doi.org/10.1057/imfer.2016.11. coverage gaps, and significant time lags.26Menzie D. Chinn and Hiro Ito, “What Matters for Financial Development? Capital Controls, Institutions, and Interactions,” Journal of Development Economics 81 (1): 163–192, https://doi.org/10.1016/j.jdeveco.2005.05.010. Our indicator is compiled for outflows and inflows and covers three types of restrictions: national security reviews, sectoral and operational restrictions, and repatriation requirements and other foreign exchange restrictions. The scoring is based on a proprietary framework derived from information contained in the IMF’s Annual Report on Exchange Arrangements and Exchange Restrictions (AREAER) as well as proprietary research on national security review mechanisms and sectoral restrictions.27Annual Report on Exchange Arrangements and Exchange Restrictions 2019, International Monetary Fund, August 10, 2019. https://www.imf.org/en/Publications/Annual-Reporton- Exchange-Arrangements-and-Exchange-Restrictions/Issues/2020/08/10/Annual-Report-on-Exchange-Arrangements-and-Exchange-Restrictions-2019-47102.
China had a relatively high level of inward FDI restrictiveness in 2010 and has successfully implemented reforms to reduce some of these barriers by 2022. Its restrictiveness score has therefore decreased from 7.3 in 2010 to 5 in 2022. However, China maintains not just national security reviews, but an expansive negative list of restricted sectors as well as foreign exchange restrictions for foreign companies. Its restrictiveness score is still far higher than the open-economy average of 1.8. Key improvements in 2022 include the National Development and Reform Commission (NDRC) and MOFCOM removing two sectors from the negative list, while the NDRC and State Council also issued measures to encourage foreign investment in manufacturing and certain services sectors.
At the same time, open economies have become more restrictive when compared to 2010. For instance, multiple market economies rolled out sanctions or other restrictions on Russia due to the war in Ukraine. Others, such as Canada and Spain, also increased the scope of their investment screening regimes for strategic and national security reasons. Noteworthy 2022 restrictions were implemented by the United Kingdom—the National Security and Investment Act that significantly amended the foreign investment screening mechanism—and the United States—the Inflation Reduction Act (IRA) that excluded Chinese investors from certain government subsidies to the electric vehicle industry28Thilo Hanemann et al., “Vanishing Act: The Shrinking Footprint of Chinese Companies in the US,” Rhodium Group, September 7, 2023. https://rhg.com/research/vanishing-actthe- shrinking-footprint-of-chinese-companies-in-the-us/#:~:text=Most%20importantly%2C%20Congress%20enacted%20powerful,Inflation%20Reduction%20Act%20(IRA). and a new executive order that strengthened the screening mechanism for inbound foreign investments.
China’s score on outward FDI restrictiveness was very high in 2010, reflecting a regime requiring approvals for every single outbound investment. Beijing made a significant push over the following decade to give firms more autonomy to invest abroad, especially in 2014 when China moved to a system that required firms to register their investments instead of obtaining approval. However, Beijing retracted these liberal policies in 2017 after large capital outflows. At 6.3, China’s 2022 outbound FDI restrictiveness score remains the same as in 2020 and 2021, and only slightly lower than in 2010. By comparison, the open market economy average was 0.6, relatively stable across all sampled years. In 2022, the United States’ outbound FDI restrictiveness score increased slightly with the rollout of the CHIPS Act that limited company transactions that would boost the semiconductor capacity of China or other foreign “countries of concern” for a decade.
Composite score
On aggregate, our Direct Investment Openness Composite Index puts China at 2.18 in 2022, against an open-economy average of 6.3 (Figure 7). Based on the same criteria, China scored 2.13 in 2021, 2.14 in 2020, and 0.65 in 2010. China’s composite score lags in both the de facto and de jure indicators, ranking last across all four measured years. China still maintains strict capital controls which limit its de jure scores; it also punches well below its weight when it comes to de facto measures of FDI intensity. Despite the conventional narrative about the growing impact of China’s FDI flows abroad—such as in FDI in the EU’s EV sector—and its historical ability to attract FDI, China’s performance is modest when scaled to its economic size.
As with other indicators, our de facto measures for direct investment openness are imperfect because they are influenced by a host of non-policy variables, such as market size, economic growth, and business cycles. Our measures for de jure restrictiveness reflect scoring judgments that are subject to a certain degree of subjectivity.
A year in review: china’s 2022 direct investment policies and developments
track the pace and direction of change. On a quarterly basis, we track policy developments that could push China either closer or further from the average of market economies in terms of its direct investment openness. From this exercise, we conclude that China’s policies toward FDI have not changed significantly in the last year. We take note of de facto developments and incremental policy changes that took place in 2022 below:
According to official data, in 2022, China saw a 9 percent year-over year increase in inbound FDI. However, this contrasts starkly with alternative measures of inward FDI, such as the announced greenfield FDI deal value reported by fDi Markets and total completed mergers and acquisitions (M&A) value from Bloomberg. Compared to MOFCOM’s reported $189 billion in direct investment that flowed into China in 2022, the other comparison sources only reported $16 billion in greenfield FDI and $25 billion in M&A transactions for the year. MOFCOM data is dominated by “round tripping” flows from Hong Kong, a common loophole to avoid China’s capital controls. China’s official data on inbound FDI has become increasingly different from micro-level transaction data since 2019. In 2022, the announced foreign greenfield deal value in China fell by 50 percent compared to 2021. The same year saw a 44 percent decrease in announced M&A deal value from the previous year. The alternative inbound data show China’s domestic investment environment has become less attractive to foreign investors, which aligns with foreign business survey results.
In H1 2022, China’s policy on managing FDI remained stable. Only in the second half of the year did China roll out policies aimed at promoting FDI inflows, likely in response to an unprecedented drop in both greenfield investment and M&A during the first seven months of the year. The State Council, NDRC, MOFCOM, and other ministries implemented partial-opening policies—encouraging foreign investment in manufacturing, opening the services sector in certain cities, and supporting foreign enterprises to invest in high-tech equipment and components—along with high-level statements. However, the impact of these measures remains to be seen.
In addition to tracking policy developments, we are also watching higher-frequency to gauge progress. Figure 7.2 presents these indicators, including measures of China’s outbound and inbound FDI flows; the inward and outward FDI stock for the top ten market economies; and China’s role in global M&A transactions.
Figure 7.1: Annual indicators: Direct investment openness (2022*)
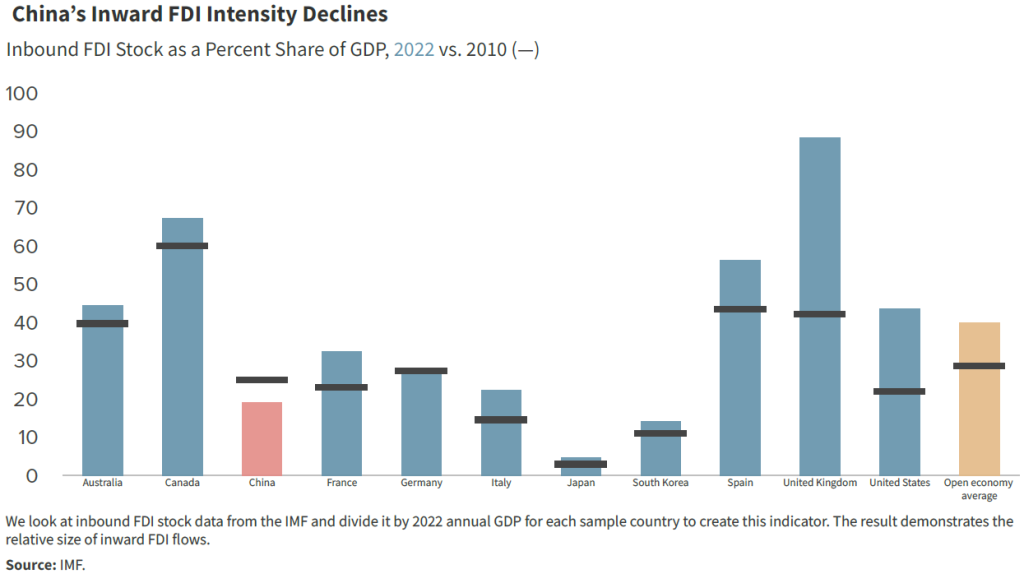
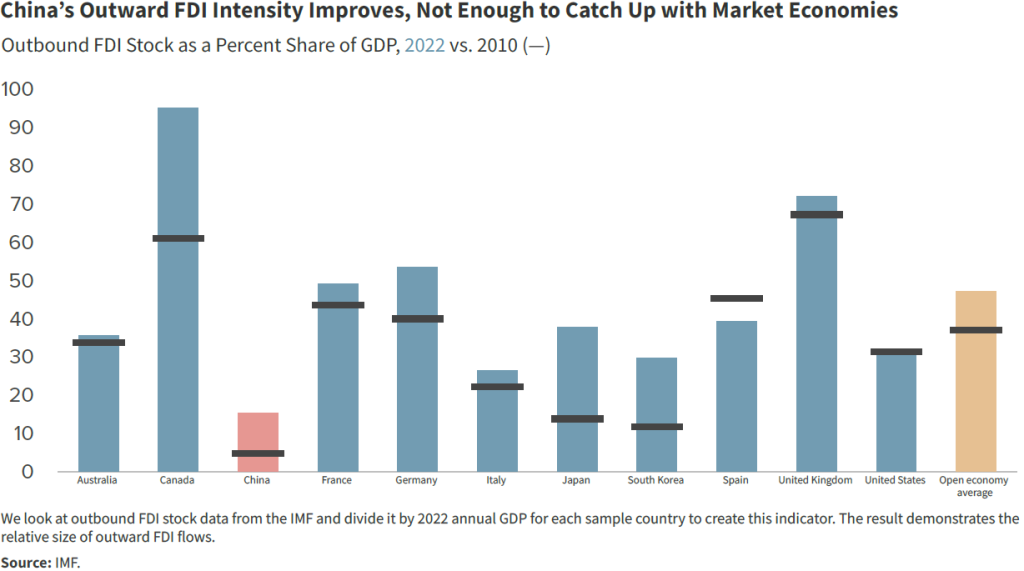
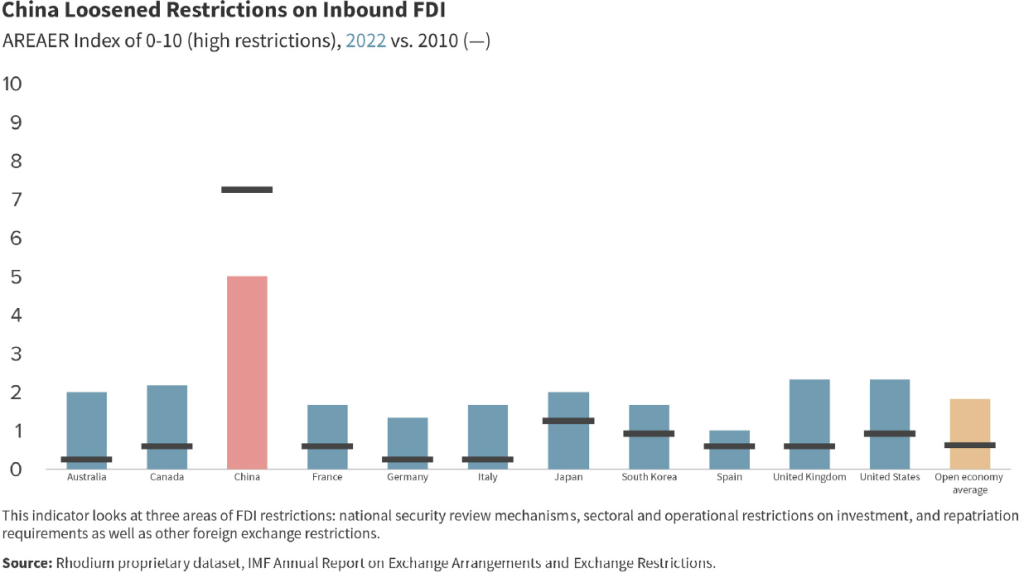
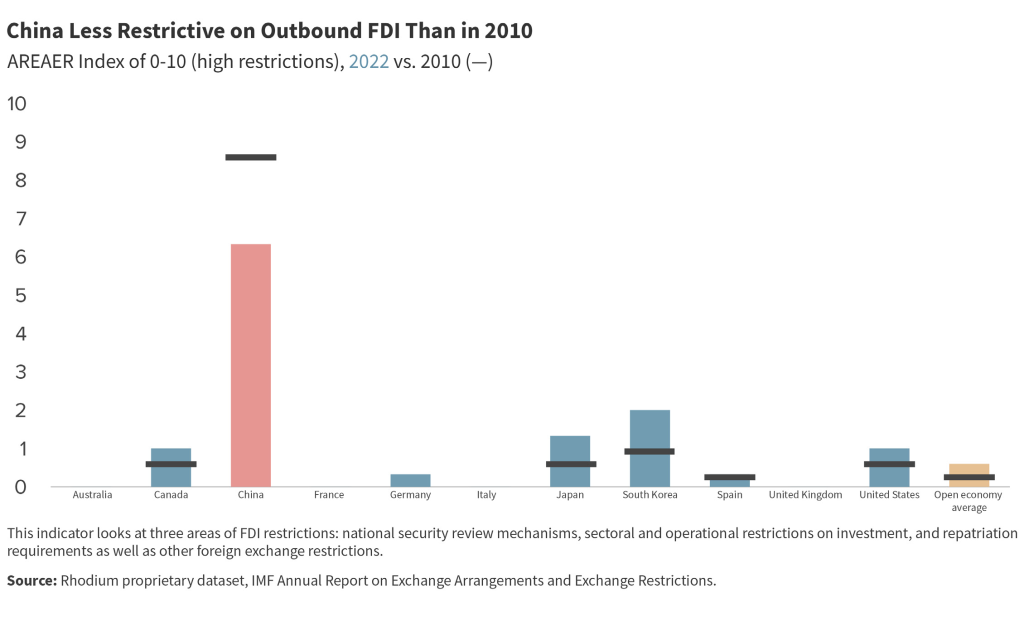
2.6 Portfolio investment openness
Figure 8: Composite index: Portfolio investment openness, 2022
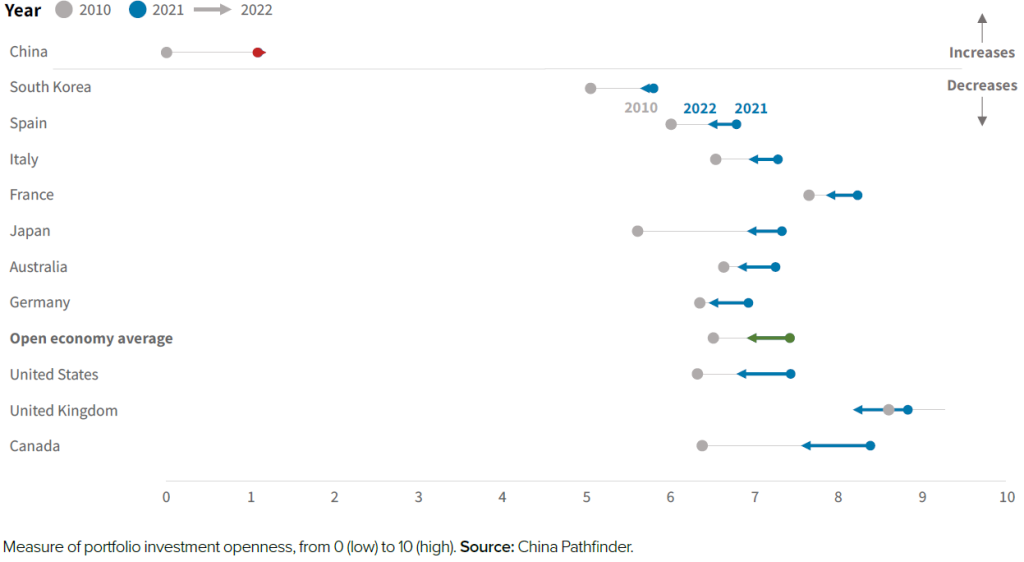
Definition and relevance
Portfolio investment openness refers to limited controls on twoway cross-border investment into equities, debt, and other financial instruments. Portfolio investment openness is a key ingredient for financial market efficiency and market-driven exchange rate adjustments in open market economies.
How does china stack up in 2022?
We apply the following annual indicators to benchmark China against open market economies in terms of portfolio investment openness.
Internationalization of debt and equity markets
To measure de facto openness to portfolio investment, we calculate the sum of cross-border debt (government and corporate bonds) assets and liabilities relative to the size of the economy as well as the sum of cross-border equity (stocks) assets and liabilities relative to the size of the economy. Assets are holdings of foreign securities by residents, and liabilities represent foreign holdings of securities issued by residents. China significantly lags behind the open-economy average in both categories. In 2022, China’s cross-border debt assets and liabilities as a share of GDP were 6.1 percent, compared to the open-economy average of 80 percent. Its cross-border equity assets and liabilities were equivalent to 9.5 percent of GDP, a nearly 15 percent drop from their 2021 share, and well short of the open-economy average of 86 percent. While China has made some progress since 2010, particularly in debt assets and liabilities, its previous years’ gains in equity internationalization were largely erased in 2022. In 2022, nearly all economies’ scores dropped, likely as a result of faster GDP growth associated with the pandemic recovery.
Portfolio investment restrictiveness
For a de jure perspective, we created our own Portfolio Investment Restrictiveness Indicator that captures regulatory restrictions on portfolio investment flows based on the IMF’s AREAER database and our own research. We calculate separate indices for portfolio outflow and inflow restrictiveness, assigning numerical scores based on the implementation of opening or closing measures during a given year. The inward portfolio restrictiveness indicator captures restrictions on the purchase of bonds and equity securities locally by nonresidents as well as on the sale and issuance of bonds and equity securities abroad by residents. The outward portfolio restrictiveness indicator captures restrictions on the purchase of foreign securities by residents as well as restrictions on the sale and issuance of bonds and equity securities locally by nonresidents.
On inward portfolio restrictiveness, China has historically tightly limited the inflow of foreign short-term capital, except through narrow programs such as the Qualified Foreign Institutional Investor (QFII) Scheme. While access has expanded through stock and bond connect schemes over the past decade, foreign investors still face quotas and inadequate cross-border settlement infrastructure. China’s 2022 restrictiveness score of 6.3 remains well above the market economy average of 0.6, despite marginal loosening of restrictions in 2021–2022, including allowing certain foreign institutional investors to access the interbank bond market directly rather through the bond market connect.
On outward portfolio restrictiveness, China has been cautious to liberalize due to concerns about large-scale capital outflows and implications for financial system and exchange rate stability. There was limited easing in 2021, with the expansion of the Shanghai– London Stock Connect to Swiss and German markets. However, households remain generally unable to invest in overseas securities and institutional investors remain constrained to special programs and quotas, keeping China’s 2022 restrictiveness score of 7.5 far higher than the advanced economy average of 0.5.
Composite score
Our Portfolio Investment Openness Composite Index puts China at 1.2 in 2022, against an open-economy average of 6.9 within our sample of the ten largest open market economies (Figure 8). This is an improvement from a score of 1.1 in 2021, and 0 in 2010. In previous editions of the China Pathfinder report, China’s score in portfolio openness was 0 for all surveyed years, since it had the lowest level of openness among sampled countries across all indicators. The updated normalization method captures countries’ progress or regression compared to their performance in prior years. This is possible because each indicator’s minimum and maximum is calculated across all years of data. China’s portfolio investment openness was lowest in 2010, but it has improved marginally since then and is no longer the absolute minimum. We therefore can show its improvement even if it still ranks behind other countries. Relative to 2010, we have seen improvements in the ability of foreigners to access and participate in China’s markets, which is reflected in the new scoring system. The revised methodology still shows a large gap between China and the OECD economies, which is not surprising given that China exercises a level of control over its capital account that is distinct from open market economies.
Particularly in the de jure measures of portfolio openness we have seen large improvements in the ability of foreigners to access and participate in China’s markets relative to 2010. For instance, the RMB Qualified Foreign Institutional Investor (QFII) program that allows foreigners to invest in China’s capital markets increased its quota numerous times since 2010. China has also created the stock and bond connects—launched in 2014 and 2017, respectively—that give foreign investors access to Chinese A-shares and bonds.
Portfolio investment is highly mobile and volatile, so our de facto measures are susceptible to fluctuations caused by market sentiment, macroeconomic dynamics, and other factors. We noticed this particularly to be the case for 2022 portfolio volume as a share of GDP data, with sizable declines for both China and OECD economies compared to 2021. Portfolio investment data are also heavily impacted by tax optimization and financial system designs. Finally, our measures for de jure restrictiveness are based on human judgment and, thus, reflect a certain degree of subjectivity.
A year in review: China’s 2022 portfolio investment policies and developments
We update the abovementioned benchmark indicators yearly to track the pace and direction of change. On a quarterly basis, we track policy developments that could push China either closer or further from the average of market economies in terms of its portfolio investment openness. From this exercise, only one development from 2022 was a definitive market reform signal:
After a more than decade-long dispute between the US Public Company Accounting Oversight Board (PCAOB) and China’s CSRC over access to Chinese audit work papers, in August 2022 Chinese authorities agreed to the inspection of accounting documents. This defused the risk that US-listed Chinese firms (that use Chinabased auditors) would be forced to delist due to noncompliance. The PCAOB confirmed that it secured “complete access to inspect and investigate” Chinese audit firms in 2022. This marks a positive shift in China’s approach to accounting transparency since developments assessed in our last year’s report.29Daniel H. Rosen et al., “China Pathfinder 2022 Annual Scorecard,” Atlantic Council and Rhodium Group, October 2022. https://chinapathfinder.org/china-pathfinder-2022-annual-scorecard/.
In addition to tracking policy developments, we are also watching higher-frequency, often China-specific, indicators to gauge progress. Figure 8.2 presents these indicators, including the change in foreign holdings of Chinese bonds and equities; foreign holdings of Chinese portfolio securities by investor country; total foreign holdings of RMB assets; the share of China’s currency in international payments; and net movement through the Shanghai-Hong Kong and Shenzhen-Hong Kong Stock Connects.
Figure 8.1: Annual indicators: Portfolio investment openness (2022*)
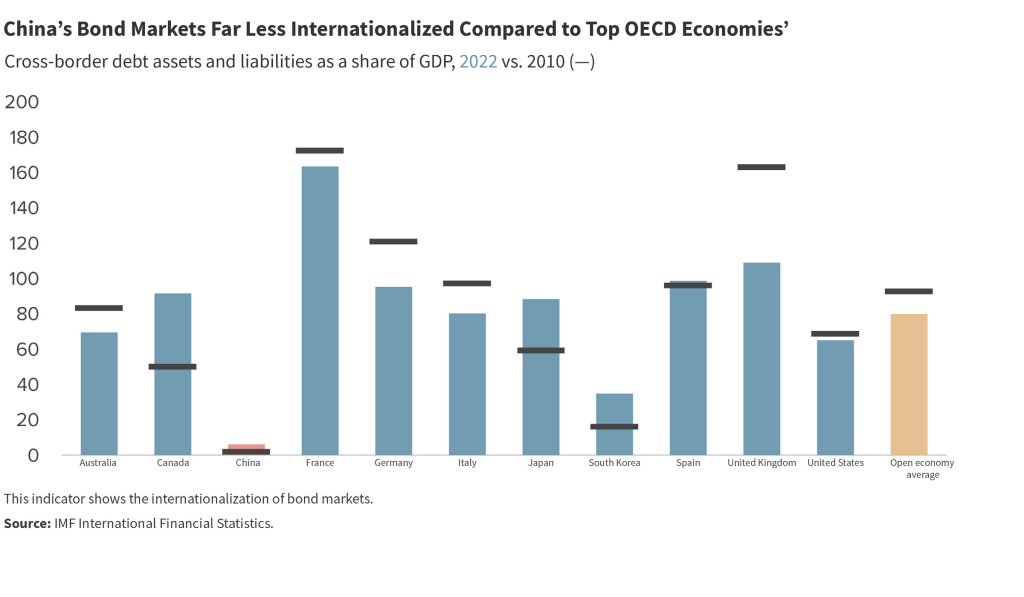
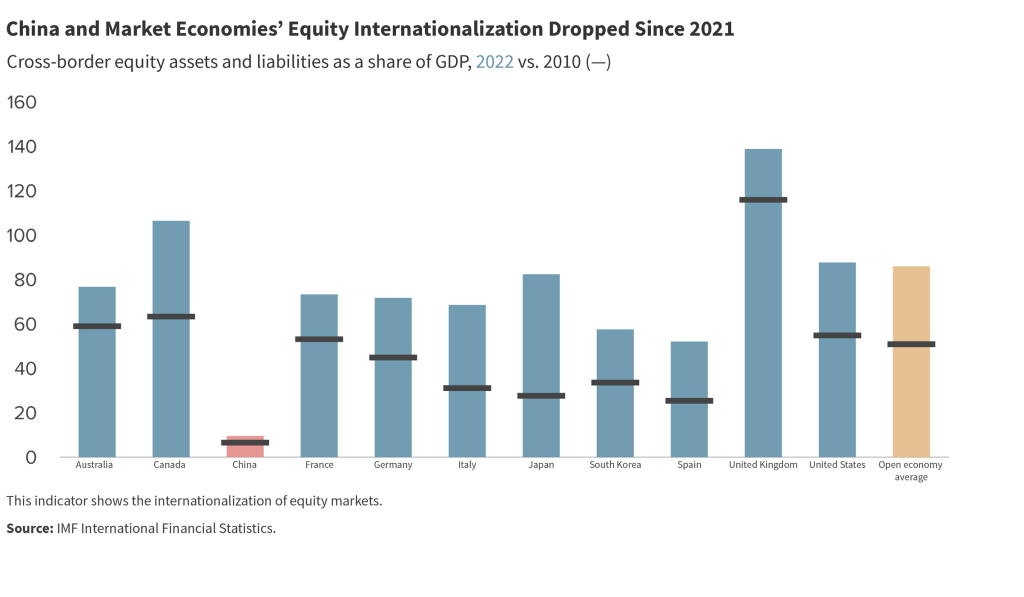
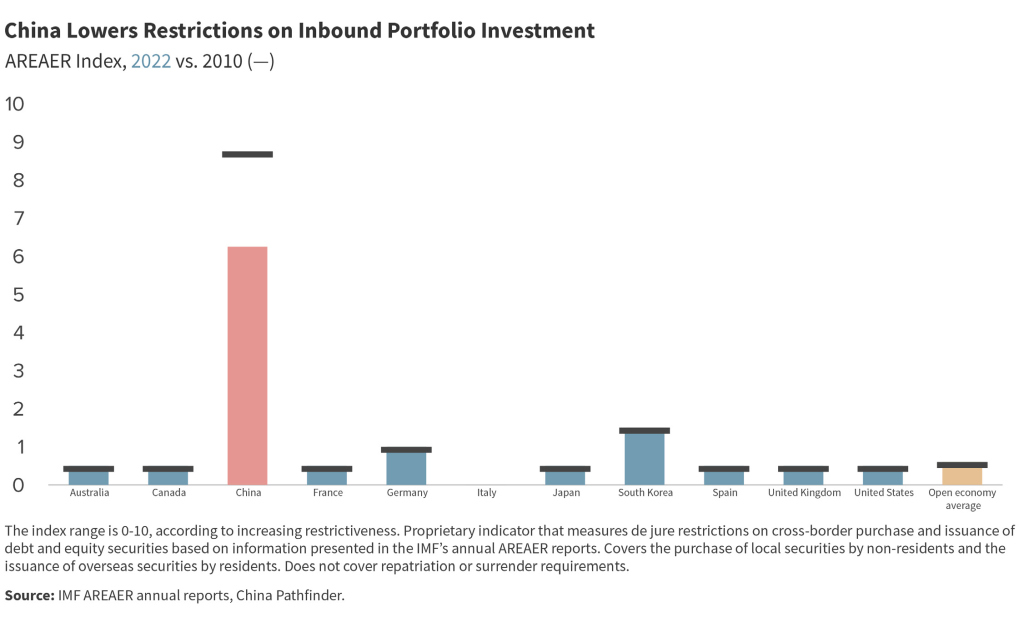
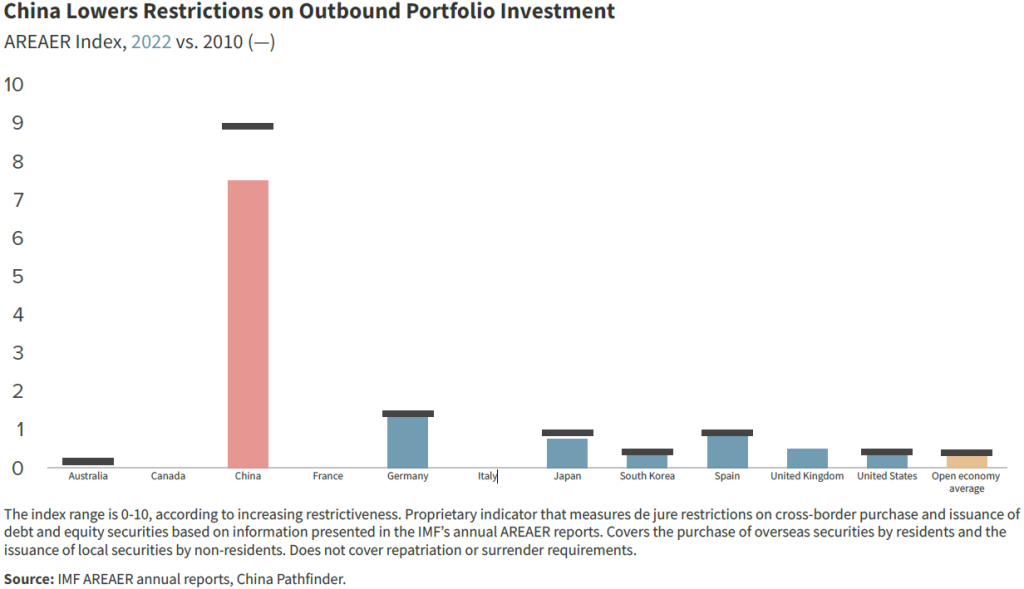
Chapter 3: Conclusions and implications
China’s economic slowdown in 2023 is largely attributable to its persistent structural reform gap, lagging behind top OECD economies in most market dimensions except for trade and innovation. While there is a global drift away from market norms among OECD countries, China faces regression in its financial system development and growing state ownership in key industries. Trade, although a bright spot, faces constraints due to changing pandemic conditions and trade defense measures by trading partners. Domestic business sentiment is suffering due to unpredictable regulatory developments, reflected in lower venture capital investment and weaker private business investment. Foreign investor confidence is also waning, as indicated by declining inbound FDI, posing a threat to an economy that still heavily relies on foreign capital and technology.
- Among the various explanations for China’s 2023 slowdown, the persistent structural reform gap through last year is the prime candidate: As China approaches the 10th anniversary of the 2013 Third Plenum, it remains far behind the top ten OECD economies in most dimensions of a market economy except for trade and innovation. In fact, its score has declined for market competition.
- There is some backsliding by market economies, but causes vary: In financial system development, the OECD economies in our sample drifted away from market norms in 2022 for the second year in a row. The main factors driving this backsliding were a decline in market capitalization (direct financing of firms relative to GDP size) and outstanding non-financial corporation debt as a share of GDP. This reflects the state of the global economy, rather than governments closing off market access or implementing new restrictions. Market economy scores also took a hit in portfolio investment, and largely for the same reason. In terms of market competitiveness, EU economies saw their 2022 scores decline compared to 2021, due to growing state ownership among top ten firms and higher industry concentration. And where China’s restrictions on inbound FDI were marginally lowered in 2022, such barriers were elevated in several other countries.
- Trade is under pressure: China is within the OECD range in trade openness, and its position in goods trade continues to rise. However, the pandemic conditions that fostered China’s trade advancement have abated, and in the more advanced area of services trade, China remains a laggard. The environment for China’s exporters is also under pressure, as pandemic-era deficits, dependence on China for strategic inputs, and growth in electric vehicle exports provoke heightened trade defense measures by China’s trading partners. In fact, most OECD countries in our sample have seen their scores in trade openness decline compared to the 2010 baseline (though all improved between 2021 and 2022).
- The private sector is in need of a boost: From 2021 to 2022, the share of SOEs in China’s top ten firms across 11 industries increased from 44 percent to 57 percent. The growth in state ownership was even more apparent in the high-growth, high-salary financial and tech sectors. The rising state role and unpredictable regulatory developments have badly damaged China’s domestic business environment. Venture capital (VC) investment as a share of GDP in 2022 dropped below 2020 and 2021 levels. While officials nominally declare the crackdown on tech companies over, and new Premier Li Qiang announced new measures to support private sector development in summer 2023, business sentiment continues to be severely depressed as reflected in weak private business fixed-asset investment.
- Foreign investors are staying home: China’s inbound FDI stock as a share of GDP has been declining, falling from 21.5 percent in 2021 to 19.1 percent in 2022. In fact, China’s inbound FDI intensity has been falling since 2010, when it was at its highest at 25.8 percent. This decrease is a warning sign for an economy that continues to rely on foreign capital, know-how, and technology. Meanwhile, surveys of major business associations for US, EU, and Japanese businesses all show falling confidence in China as a favorable investment destination.
- While China’s financial system score improved slightly in our framework for technical reasons, vulnerabilities have come to a head: Market forces tend to converge GDP growth rates and interest rates, whereas in China borrowing costs tend to be well below headline economic growth. China’s historic 2022 GDP growth shortfall narrowed this indicator gap for China, giving it a better financial system score. But underlying financial conditions and the risk of a debt crisis got worse last year and are still more concerning in 2023, forcing authorities to intervene heavily.
Implications
We attribute China’s 2022 GDP growth shortfall to a lack of structural reform, rather than COVID or cyclical policies, and explain the current economic slowdown the same way. The implication of this analysis is that 2023 growth will also fall well below the 5-6 percent target, whether or not the official data acknowledge it. Given the lack of major reform announcements year-to-date, similar weakness in 2024 should be expected. If Beijing does announce meaningful big bang reforms, growth would be even lower in 2024 as a result of adjustment pains. Not long ago many observers assumed China would surpass the US in absolute GDP size by the end of the 2020s. In light of current performance in China and the US, that will not happen in this century, let alone this decade. This change in expectations has global implications. For developing countries, the relative allure of liberal markets versus China’s “state capitalism” approach will shift, in ways that require policymaker and business leader attention.
- Tech ambitions at risk: China’s difficulty in reforming its economic structure is a threat to growth prospects. This is evident in numerous sectors, notably in the technology industry. The government’s crackdowns on tech companies have aggravated youth unemployment concerns and impeded high-tech aspirations. In 2022, Beijing prioritized lockdowns and security for political messaging over tech-sector recovery, leading the most important firms in the industry to threaten to abandon China. Beijing is now scrambling to reestablish domestic and foreign private sector confidence. In 2023, it rolled out a package of 31 initiatives aimed at bolstering the private sector, and held numerous sessions on boosting China’s innovation capabilities. Most recently, Beijing announced it will create a new bureau to support the private sector. But credibility is impaired, and Beijing will need to match actions to words before companies feel more confident.
- Fiscal challenges are structural and need fixing if confidence in China’s future is to be restored: Sub-national governments in China are grappling with massive debt loads, while they are responsible for providing most social services. An aging population requires healthcare and pension payouts, while poverty alleviation remains a major challenge. Industrial policy, military and public security spending, education, decarbonization, overseas assistance and myriad other promises are not yet funded: the implication of the growth outlook is that many of these activities will need to be moderated.
- Global spillovers: For many countries and firms, globalization has increased dependency on China’s economic success. As recently as April 2023, the IMF was projecting China to be the primary driver of global growth through 2028. A slower-growing China means negative spillovers for many around the world, including nations dependent on exports to China to generate earning to repay Chinese debt. From German car manufacturers to Australian iron ore, this is not just a concern for the global south.
- Geopolitics and geoeconomics: The persistence of Chinese GDP growth at rates a multiple of OECD growth has been the foundation of China’s external power and influence, both economic and political. With or without reform, China’s future growth average will be lower, in absolute terms and relative to the United States and other OECD economies. This will reshape expectations for great power competition. Sometimes countries undergoing a slowdown behave more moderately, other times they react belligerently. But in any case, China’s behavior over the last 10 years—assertive external policies without regard for economic consequences—is likely to change.
Looking ahead
2023 has already been a tumultuous year in China, and this is more to come. At the third plenary session of the Central Committee this fall, Party leaders will set economic priorities for the coming five years. Structural threats to economic stability have never been greater. The State Council has explicitly promised a comprehensive reform plan to deal with these existential risks, including the property sector and, especially, local government debt levels that are spiraling out of control. In the past, Beijing was able to kick the policy can down the road; today, they are at the end of that road and need to address the present problems. The question is what policy moves would be credible enough to restore confidence. Here are five moves that could instill optimism for 2024:
- Robust debate about the structural slowdown and reform: Chinese government signals in 2023 have been mixed. On the one hand, Beijing suppressed datasets at odds with an optimistic view (for instance youth unemployment numbers) and forbade discussion of disinflation. On the other hand, retired officials and respected economists were permitted to speak publicly about the structural nature of China’s slowdown by mid-year, calling for overdue reforms. Wider room for public debate about the economy would be a positive signal.
- Retire the GDP growth rate target: Few indicators have been as emblematic of China’s relentless pursuit of growth as the GDP growth target. With the exception of 2020, Beijing set a growth target every year, and always met or exceeded it, until 2022. But prioritizing growth-at-all-cost, even when that means tolerating frequent manipulation of data to achieve the desired results, has damaged long-term economic potential. The GDP growth target is a political imperative for the Party, tied to the goal of doubling GDP by 2035. Shifting to market economy type targets— employment and inflation—is one of the best things Beijing can do to improve the quality of growth and policymaking.
- Central-local fiscal rebalancing: For Beijing to provide a social safety net and foster prosperity for the Chinese people, local governments must be bailed out and put on a firm fiscal footing. The current system, which sees local governments on the hook for most expenses but retaining only a small portion of the tax revenues they collect, left local governments reliant on land sales or LGFVs to raise funds. The consequences—ballooning local debts and financial instability—are undermining China’s prospects. The central government must absorb local expenditure responsibilities or identify responsible resourcing strategies.
- Privatizing some state assets: In 2023, China’s government rolled out reforms that transition its IPO system to a completely registration-based one rather than an approval-based one. This could lay the groundwork for a gradual privatization of state assets. While no big bang is anticipated in 2024, local governments should move toward listing their SOEs, inviting private capital and, in the process, filling up their depleted assets. For this to become a full-throated pro-market reform, the government should also allow private investors to have a say in how the companies are run, rather than merely providing silent capital.
- Reforming the pension system: China’s slowdown, coupled with its rapidly aging population and shrinking workforce, is bad news for local governments facing growing fiscal constraints. Beijing must do something to place the pension system on a more stable financial footing. This likely involves more direct central government control and responsibility for shortfalls in local pensions, as well as enabling new sources of local revenues such as property taxes and broadening the tax base. It also likely involves reforms such as raising the retirement age, which is relatively low by global standards (60 for men, 50-55 for women).
At the intersection of economics, finance, and foreign policy, the GeoEconomics Center is a translation hub with the goal of helping shape a better global economic future.
About China Pathfinder
Mission
China Pathfinder is a joint initiative from the Atlantic Council’s GeoEconomics Center and Rhodium Group that measures China’s economic system relative to advanced market economy systems. Few people, even within the circle of China experts, seem to agree about the country’s economic system, where it is headed, or what that means for the world. The goal of this initiative is to shed light on whether the Chinese economic system is converging with, or diverging from, open market economies. Over the course of two short decades, China has risen from the world’s sixth-largest economy, with a gross domestic product (GDP) of $1.2 trillion in 2000, to the second largest, boasting a GDP of $17.95 trillion in 2022. China now intersects with the interests of most nations, businesses, and individuals. With China’s past and future systemic choices impacting the world in both positive and negative ways, it is essential to understand its global footprint. The hope is that China Pathfinder’s approach and findings can fill in some of the missing puzzle pieces in this ongoing debate—and, in turn, inform policymakers and business leaders seeking to understand China.
Partners
The Atlantic Council is a nonpartisan organization that galvanizes US leadership and engagement in the world, in partnership with allies and partners, to shape solutions to global challenges. The Atlantic Council provides an essential forum for navigating the economic and political changes defining the twenty-first century by informing its network of global leaders. Through the papers it publishes and the ideas it generates, the Atlantic Council shapes policy choices and strategies to create a more free, secure, and prosperous world.
Rhodium Group is a leading independent research provider. Rhodium has one of the largest China research teams in the private sector, with a consistent track record of producing insightful and path-breaking analysis. Rhodium China provides research, data, and analytics to the private and public sectors that help clients understand and anticipate changes in China’s macroeconomy, politics, financial and investment environment, and international interactions.
Authors
This report was produced by Rhodium Group’s China team in collaboration with the Atlantic Council’s GeoEconomics Center. The principal contributors on Rhodium’s team were Daniel H. Rosen, Nargiza Salidjanova, and Rachel Lietzow. The principal contributors from the Atlantic Council’s GeoEconomics Center were Josh Lipsky, Jeremy Mark, and Niels Graham.
Acknowledgments
The authors wish to acknowledge a superb set of colleagues and fellow analysts from the public sector, international organizations, think tanks, business associations, and universities who helped us strengthen the study in group review sessions and individual consultations. These individuals took the time, in their private capacity, to critique the indicators and analysis in draft form; offer suggestions, warnings, and advice; and help us to ensure that this initiative makes a meaningful contribution to public debate.
The authors also wish to acknowledge the members of the China Pathfinder Advisory Council: Steven Denning, Gary Rieschel, and Jack Wadsworth, whose partnership has made this project possible.
This report is written and published in accordance with the Atlantic Council’s intellectual independence policy. The authors are solely responsible for its analysis and recommendations. The Atlantic Council, Rhodium Group, and its donors do not determine, nor do they necessarily endorse or advocate for, any of this report’s conclusions. This report is published in conjunction with an interactive data visualization toolkit, at http://chinapathfinder.org/. Future quarterly and annual updates to the China Pathfinder Project will be published on the website listed.
Image: An incomplete road on the construction site of the former Kai Tak airport in Hong Kong.