Just how happy are Iranians with their lives?
The coronavirus lockdown was a perfect time to binge-watch Iranian movies of diverse genres. What struck me was that, in so many scenes of these movies, the characters would get into verbal conflict at the slightest trigger soon after the ubiquitous Persian ta’arof or polite-talk.
While that was only drama, I, nevertheless, became curious about whether this quick irritability and the type of language used aptly capture the zeitgeist of today’s Iranian society. After all, American movies of the 1950s and 60s used a different lingo and manner of speech than today’s films. Clark Gable’s “Frankly, my dear, I don’t give a damn” in Gone with the Wind had once caused considerable uproar. Or in old movies it is rare to hear any swear words, while the opposite is pervasive in contemporary ones and equally common in the vernacular.
I raised my observations with several friends, one of whom was Yassamin Maleknasr, an Iranian filmmaker, who confirmed that screenplays did, indeed, realistically portray everyday dialogue and the propensity to verbal clashes. My commentators concurred that Iranians are genuinely unhappy and on edge, and attributed people’s easy touchiness to exhaustion with ever-worsening economic conditions—even before COVID-19—caused by, among other things, decades of punitive sanctions and internal economic mismanagement.
Surely, there are many poor and poorly managed countries in the world. How does Iranians’ sense of wellbeing fare in comparison to others’? In the post-Arab Spring era, I had written about the Economics of Happiness and Anger in North Africa in a chapter for a 2015 Oxford Handbook on Africa and found valuable data and insights from the then newly launched UN World Happiness Report (WHR) and its measurement tool, the World Happiness Index (WHI).
The World Happiness Report
The first issue of the report was published in 2012, after the UN convened a meeting on the topic of Wellbeing and Happiness: Defining a New Economic Paradigm. It was in response to a growing body of literature that GDP and economic growth were not sufficient, or even good, predictors of a nation’s prosperity and contentment. In fact, the happiness-income paradox—known as the Easterlin paradox—suggests that “at any point in time both among and within nations, happiness varies directly with income, but over time, happiness does not increase when a country’s income increases.”
For the WHR, experts in fields ranging from economics to psychology came together to define a set of indicators of subjective wellbeing and develop a methodology for measurement so that progress over time could be assessed. The purpose was to find a more holistic approach for countries to gauge the happiness of their citizens and guide their policies. As with any indicator or approach, it has its critics.
The data for the calculation of the index capture a mix of subjective responses obtained from the 2005 to 2019 Gallup World Polls (GWP) of nationally representative samples—typically one thousand observations per country—as well as objective indicators taken from national statistics vetted by international organizations.
Respondents provide input with the following in mind: “Please imagine a ladder, with steps numbered from 0 at the bottom to 10 at the top. The top of the ladder represents the best possible life for you and the bottom of the ladder represents the worst. On which step of the ladder would you say you personally feel you stand at this time?” This is also referred to as the Cantril life ladder. WHR has since been published each year. Below are the main criteria:
- Income as measured by GDP in Purchasing Power Parity (PPP) at 2011 constant prices, and household Gini—a standard measure for income inequality—is based on self-reported income by respondent.i
- Physical well-being as measured by health and life expectancy at birth.ii
- Social support: “If you were in trouble, do you have relatives or friends you can count on to help you whenever you need them, or not?”
- Freedom to make life choices: “Are you satisfied or dissatisfied with your freedom to choose what you do with your life?”
- Generosity: “Have you donated money to a charity in the past month?”
- Perception of corruption: “Is corruption widespread throughout the government or not?” and “Is corruption widespread within businesses or not?”
- Positive effects: “Did you experience the following feelings during a lot of the day yesterday? Happiness? Laughter? Enjoyment?”
- Negative effects: “Did you experience the following feelings during a lot of the day yesterday? Worry? Sadness? Anger?”
So, where do Iranians stand?
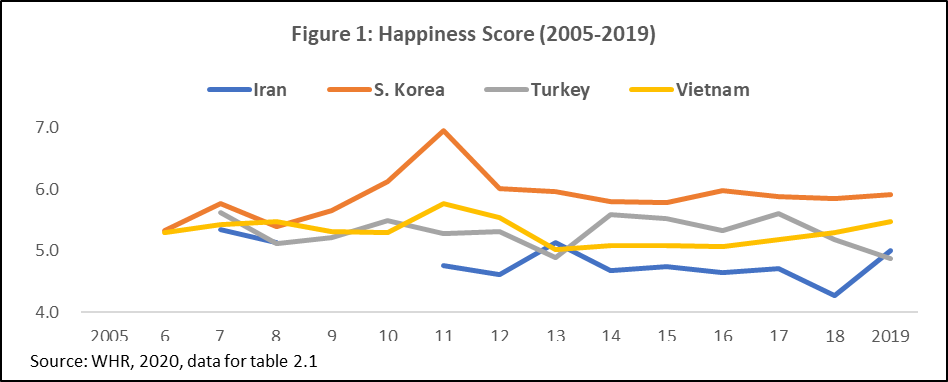
In 2019, I compared Iran’s economic performance before and after the 1979 revolution with Korea, Turkey, and Vietnam. The main finding was that Iran had underperformed relative to these countries and relative to its own potential in the past forty years. The Happiness Score (Figure 1) continues the comparison among these four countries and displays the trend of the overall score from 2005 to 2019. While Iran was in the same “happiness score neighborhood” as the other countries during 2005 to 2008—the early years of Mahmoud Ahmadinejad’s presidency—it has generally declined below the others since then.
What are the causes of Iranians’ malaise?
In the 2020 report, Iran ranks 118 out of 153 countries, slightly above the “unhappiest” quintile. The scores of the index, both overall and by category, are ranked among the countries. To answer the above question, it is useful to see Iran’s ranking in the eight subcomponents as shown in Figure 2.
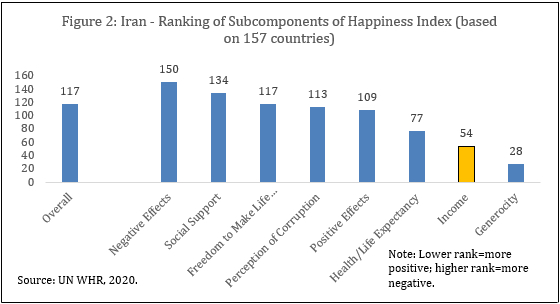
In three categories, Iran finds itself among countries in better quintiles. Physical well-being (ranked 77th) means that the population enjoys reasonably good health and life expectancy at birth. It also ranks high on generosity (28th); 52 percent of respondents reported to have donated to a charity in the previous month and 23 percent had volunteered for a cause. This is good and indicates the high level of compassion among citizens. By contrast, our measuring stick countries demonstrated far lower incidences of people-to-people generosity (see footnote).iii In terms of income, Iran ranked fifty-forth among the 157 countries, among the higher third. This suggests that economic self-assessment may not be the factor dragging down Iranians’ sense of happiness.
An important component behind Iran’s low overall rank at 118th is the disproportionately high response to ‘negative effects’ (150th), as defined by feelings of anger, worry, and sadness. The opposite, i.e. ‘positive effects’ of laughter and enjoyment fares better (rank 109th), but not enough to compensate for the weight of negative feelings. Public and private corruption is high (109th), as is the sentiment of being without help in difficult times, which is reflected in the ranking of ‘social support’ (134th). Moreover, the sense of not having the freedom to make life choices places Iran in further negative territory (117th).
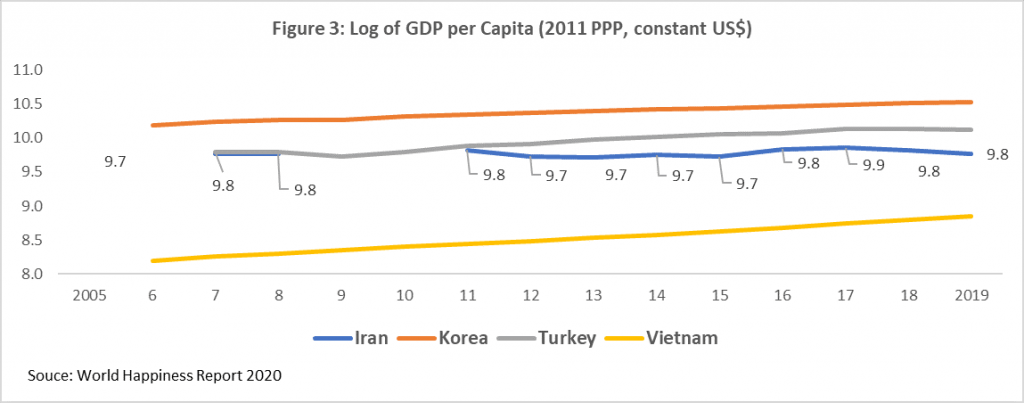
Finally, the WHI data offers the opportunity to examine the income variable over time to see if the fluctuations in the happiness scores, observed in Figure 1 (above), are caused by economic factors during the lighter or heavier sanction periods, which I essentially consider the pre- and peri-Donald Trump presidency. Figure 3 shows no discernible differences over the last 15 years.
Conclusion
Iran ranks 118 out of 153 countries on the UN’s 2020 World Happiness Index (WHI), thus slightly above the lowest quintile—the least happy. The index is largely based on representative random samples of the Gallop World Poll—around 1,000 observations per country—that reflect the respondents’ subjective answers to a set of questions. While the economic dimension is part of the overall individual self-assessed wellbeing, other factors seem to have a disproportionately greater negative impact on the Iranians’ sense of happiness at any point in time. Though undoubtedly, better economic times infuse optimism, an explanation for the malaise can be found in other dimensions of wellbeing, such as perceptions of widespread public and private corruption, dearth of social support in times of need, and a crowding out of negative effects of worry, anger and fear over the positive effects of laughter and enjoyment. Above all, the high negative response to ‘freedom to make life choices’ implies people’s sense of powerlessness to improve their lives.
Over the 2005-2019 period, Iran’s fluctuations in the overall happiness scores (Figure 1) have not mirrored the trend of the income score (Figure 3). The latter has remained flat during the lighter post-Iran nuclear agreement sanctions period, even with yearly GDP growth in the 6-7 percent range, and under Trump’s “maximum pressure” campaign, when the rates turned negative.
President Trump has said that “regime change” is not his objective. But, his administration has hoped that the “maximum pressure” strategy would foment enough discontent for people to rise up. The evidence from the WHRs suggests that, counterintuitively, the non-monetary dimensions of wellbeing, as explained above, which result from a host of domestic internal policies, impact far more negatively the self-assessment of Iranian respondents than does the income criterion. It could be that they magnify the feelings of helplessness that results from economic pressures on people’s lives, which they in part blame on sanctions.
Nadereh Chamlou is an international development advisor and former senior advisor to the Chief Economist of the Middle East and North Africa Region at of the World Bank, where she spent more than three decades in technical, coordination, managerial, and advisory positions. Follow her on Twitter: @nchamlou.
i GDP per capita (variable name gdp) in purchasing power parity (PPP) at constant 2011 international dollar prices (from the November 28, 2019 update of the World Bank’s World Development Indicators (WDI). Adjusted by household Gini as self-reported in local currency or presented with a set of ranges in local currency and are asked which group they fall into. Also, use of GINI index from the World Bank’s World Development Indicators.
ii Data are extracted from the World Health Organization’s (WHO) Global Health Observatory data repository.
iii Only 35 percent of Korean respondents donated and 21 percent volunteered; only 18 percent of Turkish respondents donated and 9 percent volunteered; and only 23 percent of Vietnamese respondents donated and 13 percent volunteered, respectively.
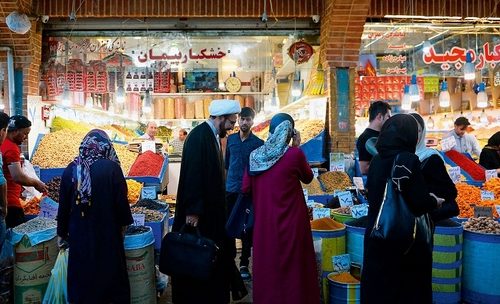
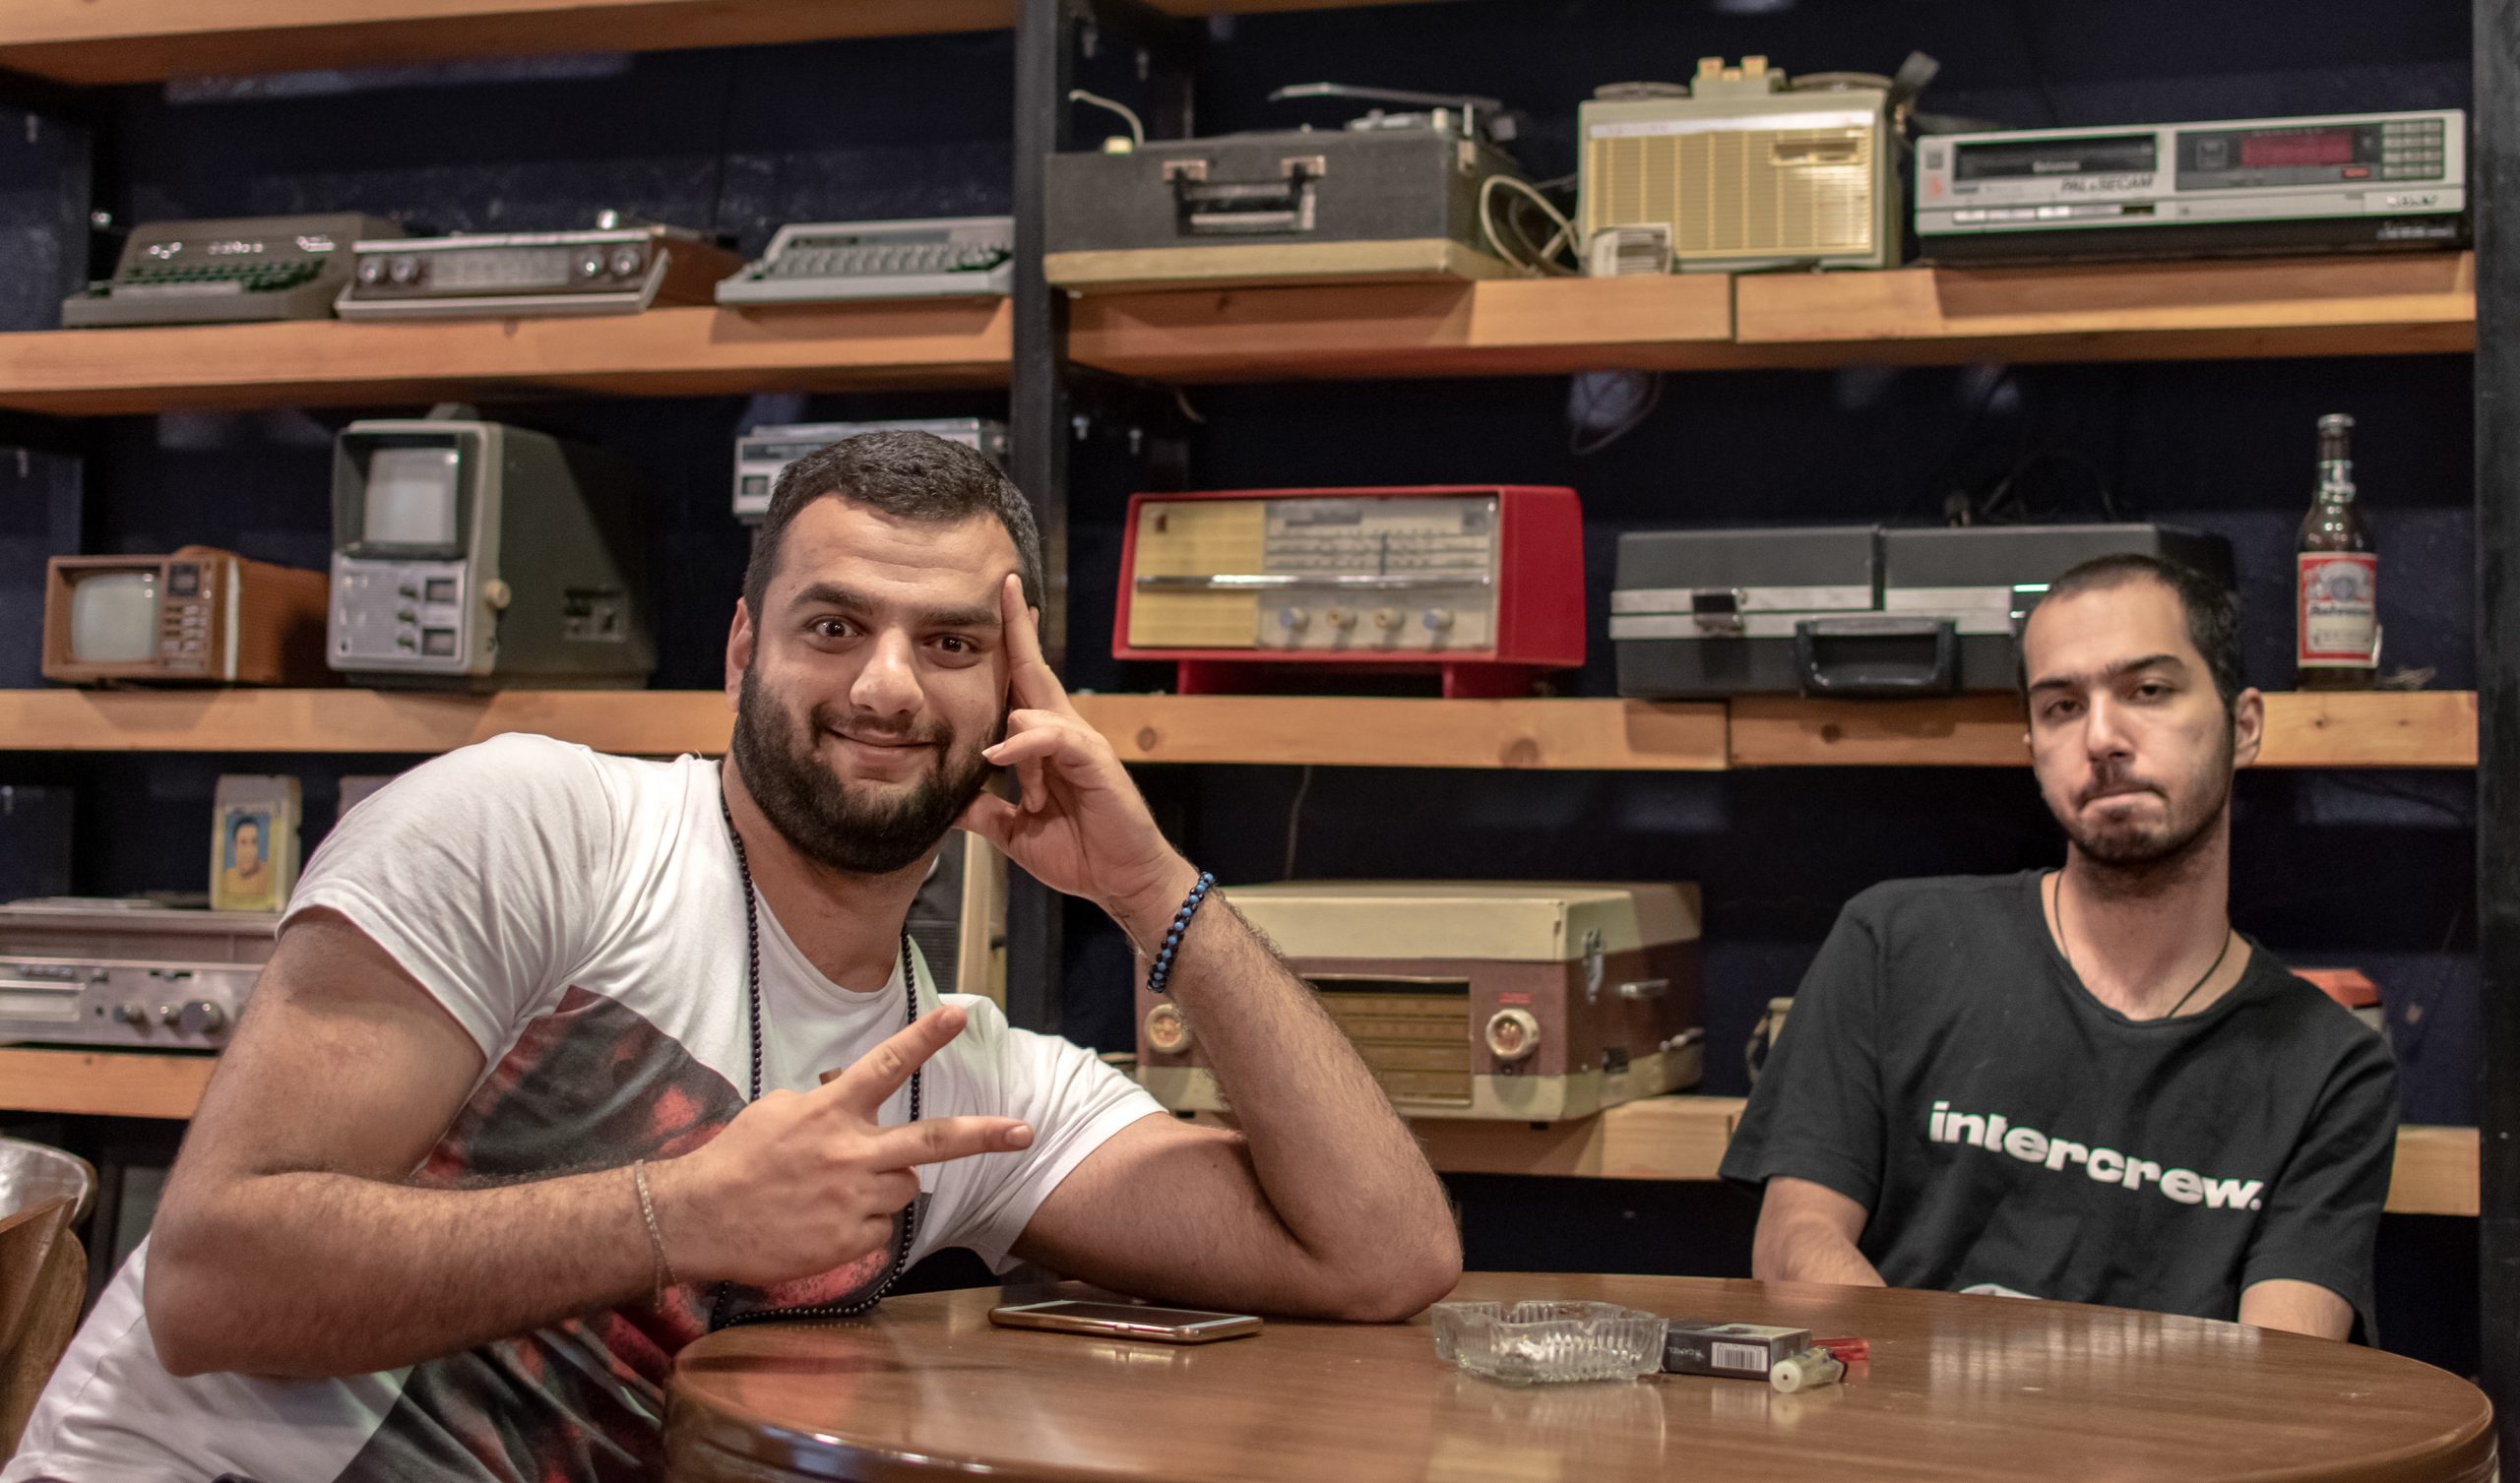
Image: Qaf Cafe in Qazvin, Iran (Ashkan Forouzani via unsplash)