Prosperity that lasts: The 2023 Freedom and Prosperity Indexes
The 2023 Freedom and Prosperity Indexes
Prosperity is highly correlated with freedom
Freedom tends to lead to prosperity
Autocracies tend to be unprosperous
Conclusions and policy recommendations
Appendix 1: Freedom and Prosperity Indexes methodology
Appendix 2: Participants in the 2023 Freedom and Prosperity Research Conference
Executive Summary
Is freedom a precondition of prosperity? Do countries that become freer also become more prosperous? How are freedom and prosperity distributed around the world today? What has been the evolution of these measures in the past twenty-eight years and why? What components of freedom and prosperity have increased or decreased the most, and where?
The Atlantic Council’s Freedom and Prosperity Center created these indexes to provide a snapshot of the current distribution of freedom and prosperity, gain a sense of the evolution of both over the last twenty-eight years at global, regional, and country levels, and facilitate an exploration of the relationship between freedom and prosperity. Our analytical work uncovered several facts.
First, freedom and prosperity are not evenly distributed around the world, with evident regional differences. Using the four categories of our rankings, Europe and North America are by far the “freest” regions of the world; Latin America is generally “mostly free”; while the Middle East and North Africa (MENA) region is generally “unfree.”
Second, the distribution of prosperity highly resembles that of freedom: regions and countries with higher scores in our Freedom Index also attain higher levels of prosperity. The statistical analysis presented in this report conveys a close association between freedom and prosperity, not only at a global level but also within regions and other subgroups of countries. Being both a free and prosperous society is not particular to Europe and North America. In all regions, countries that are free tend to also be prosperous.
Third, the scores for our Freedom Index, which are an average of the scores of our economic, political, and legal freedom subindexes, improved in most years between 1995 and 2012. After 2012, they mostly stagnated until the start of the COVID-19 pandemic in 2019, following which they declined. This is explained by decreases in political and legal freedom scores after 2012, offset by increases in economic freedom.
The women’s economic freedom global score, an indicator in the economic freedom subindex, has shown a steady and dramatic improvement. It increased 34 percent over our analysis period, from 54.0 in 1995 to 72.4 in 2022. Improvements occurred in all seven geographic regions of our indexes.
Fourth, global prosperity grew every year between 1995 and 2019, after which the COVID-19 pandemic caused a decline. The rate at which prosperity increased was slower after 2012, the year when political and legal freedom started their decline. Prosperity increased an average of 0.4 points per year between 1995 and 2012, but only 0.1 points between 2012 and 2022. Our only prosperity declines were in 2020 and 2021, caused by the pandemic.
There are several regional trends of note. On the positive side, sub-Saharan Africa is the region where prosperity has grown fastest. Meanwhile, prosperity growth performance in both the MENA region and South and Central America did not keep up with the global pace.
The Freedom and Prosperity Center’s mission is to increase the well-being of people everywhere—and especially of the poor and marginalized in developing countries—through unbiased, data-based research on the relationship between freedom and prosperity.
To help in this task, the Center developed these indexes as tools to assess the freedom and prosperity performance of virtually all countries of the world and to help agents of change in their efforts to place their nations on the way to prosperity.
To be sure, there are several credible indexes and measures that quantify different aspects of freedom (democracy, economic freedom, civil liberties, and so on) or prosperity (income per capita, inequality, happiness, etc.) produced by respected organizations. The contribution of the indexes comes from their comprehensive exploration of both freedom and prosperity and the relationship between the two.
The Freedom Index includes measures of legal, economic, and political freedom. Legal freedom measures the degree to which a country abides by the rule of law. Political freedom reflects a country’s institutional framework for the selection of those holding executive political power and the limits and controls imposed on its exercise. Economic freedom measures whether the bulk of economic activity in a country is guided by the principles of free and competitive markets. We believe that all three are necessary for a society to be fully free.
The Prosperity Index takes a similarly broad view, going beyond the measurement of pure material well-being and also evaluating several other social aspects that we believe are necessary in a prosperous society. Our Prosperity Index has six indicators: income, health, education, environment, minority rights, and inequality.
The 2023 Freedom and Prosperity Indexes presented in this report introduce significant improvements over last year’s pilot version, in terms of theoretical soundness and time coverage. First, we have refined our conceptualization of freedom and prosperity following well-established economic, legal, and political science definitions. Second, we have significantly extended the time coverage of our indexes, which are now calculated yearly from 1995 up to 2022, allowing for an analysis of the medium- and long-term trends of our measures and the use of sophisticated econometric techniques.
We start with a descriptive portrayal of freedom and prosperity in the world. But we then go one step further, providing a preliminary empirical analysis of the nature of the relationship between the two variables, and concluding that freedom tends to lead to prosperity. Countries with the largest positive changes in freedom between 1995 and 2022, such as Sierra Leone, Peru, or Georgia, have also experienced large increases in prosperity. Conversely, cataclysms in terms of freedom in, for example, Venezuela, Nicaragua, Belarus, Turkey, Russia, or Yemen have been followed by severe drops in prosperity.
The analysis presented in this report is just a first step. Several questions and intuitions deserve further research, and we are committed to such a task in the coming years. At the same time, we urge researchers to use our indexes to further explore the relationship between freedom and prosperity, dig deeper into specific country cases, and suggest policy reforms as appropriate.
Similarly, we encourage agents of change around the world to take advantage of our data to identify the areas calling out for reform and to assess the effects of policies. In this sense, international organizations and the international donor community can play an important role in smoothing the transition toward representative institutions, cushioning the short-term costs of freedom-promoting reforms, and supporting agents of change in the least developed countries with the vision and commitment to place their nations on the path of freedom and prosperity.
The 2023 Freedom and Prosperity Indexes
One year ago, the Atlantic Council created the Freedom and Prosperity Center with the mission to increase the well-being of people everywhere—and especially of the poor and marginalized in developing countries—through unbiased, data-based research on the relationship between freedom and prosperity. To help in this task, the Freedom and Prosperity Center last year introduced a pilot version of the Freedom and Prosperity Indexes, a quantification effort using 2021 data to assess the performance in terms of freedom and prosperity for virtually all countries of the world. With this report, we present the updated and improved 2023 Freedom and Prosperity Indexes, using annual data from 1995 to 2022.
A distinctive aspect of the Freedom and Prosperity Indexes is their root in and reflection of an expansive understanding of what constitutes a free and prosperous society. The Freedom Index includes measures of economic, political, and legal freedom. This broader definition of freedom differentiates the index from other measures focused on specific institutional aspects (electoral, corruption, economic openness, and so on). Likewise, the Prosperity Index is more exhaustive than previous measurement projects such as the United Nations Human Development Index or various poverty indexes. The rationale for our approach is based on the premise that we can gain new insights and better understand the mechanisms that lead to overall prosperity by analyzing the relationships and interconnections between different dimensions of freedom.
During the past twelve months, the Freedom and Prosperity Center team has discussed the construction of the indexes with a wide variety of experts, academics, and policymakers, receiving useful feedback and suggestions on potential improvements. The First Annual Freedom and Prosperity Research Conference, held in Washington in February 2023, was a significant milestone in this discussion process. As a result, the new 2023 Freedom and Prosperity Indexes introduce a series of methodological changes intended to improve the time coverage and theoretical soundness of our measures, while otherwise maintaining the construct of the pilot version.
The analysis presented in last year’s report focused on scores for 174 countries based on 2021 data. That data suggested a clear, positive correlation between freedom and prosperity. The most prosperous countries in 2021 were those obtaining the higher scores in overall freedom and also in the economic, political, and legal freedom components. Nonetheless, we could not analyze rigorously the time dimension of the relationship between freedom and prosperity (and their components), and in particular the direction of causality, because of the limited time coverage of some of the sources used. To tackle this shortcoming, we have made the necessary changes in terms of data sources so that the new version of the indexes, presented in this report, are calculated annually for the 1995-2022 period. Enhanced time coverage in the second annual edition of the indexes allows for an analysis of the trends of freedom and prosperity over the last twenty-eight years, and thereby permits the use of more sophisticated econometric techniques that will help identify the causal mechanisms that drive the relationship.
Based on discussions with experts and academics, as well as on a thorough review of the literature, we have refined our conceptualization of the three dimensions of freedom—especially legal freedom—and better grounded them on solid and generally accepted legal and political science definitions.
Moreover, in our selection of data sources, we tried to maximize the identification between such definitions and their empirical counterparts, avoiding overlaps or unmeasured attributes. We also have modified our definition of prosperity, eliminating highly subjective attributes (e.g., happiness), and incorporating two new elements that are generally accepted as defining a prosperous society by the international development community (education and economic equality).
Overall, we believe that the new 2023 Freedom and Prosperity Indexes together constitute a product that is conceptually sound and will appeal to scholars and researchers as a quantification tool. It will allow the further exploration of the nature of the relationship between freedom and prosperity.
Also, the Freedom and Prosperity Indexes can aid policymakers and other agents of change in identifying areas of institutional reform with the biggest opportunity for improvement, and the highest dividends in terms of sustained and inclusive prosperity.
Indexes construction
The guiding principles for the construction of the Freedom and Prosperity Indexes are transparency, simplicity, and consistency in the methodology. We started by selecting empirical indicators with ample coverage across time and space, maximal identification with the theoretical concepts, and put out by rigorous and well-established institutions. The result is a total of thirty-four variables that are combined to form nineteen indicators, which are used to build the Freedom and Prosperity Indexes.
We use original data from eleven different institutions including the World Bank, the Varieties of Democracy (V-Dem) Project, the United Nations, and the Fraser Institute—all publicly available and widely used in academic and policy research. Besides the necessary scaling so that all components lie in the same range (zero to one hundred), we do not make any additional transformations except for gross domestic product (GDP) per capita, which is linearized before scaling by taking the natural logarithm. For the few cases for which we do not have data for a variable from a preferred source, we use alternative sources of data1This situation mainly applies to GDP per capita data for seven economies for which World Bank data, our preferred source, are unavailable. We thus obtain from data series from alternative sources such as the International Monetary Fund’s World Economic Outlook Database (for Eritrea, South Sudan, Venezuela, and Yemen), the Penn World Tables (Syria), and World Economics data (Afghanistan and Taiwan).. If a country-year observation is missing for a given variable, we use the value of the closest precedent year.
The aggregation method is also simple and transparent. When more than one variable is used to obtain a component, these are averaged with equal weights. Legal, economic, and political freedom subindexes are calculated as the equal weighted average of their respective components, and the overall Freedom Index is just the unweighted average of the three freedoms. The Prosperity Index is given by the equal weighted average of its six constitutive components.
The complete dataset of components, subindexes, and indexes for the period 1995 to 2022 is available on our website, as is a detailed discussion of our methodology. Therefore, researchers can use the indexes to further explore particular questions on the mechanisms and linkages between freedom and prosperity, as well as generate alternative measures based on different conceptualizations, aggregation methods, and so on. The full disclosure of the dataset will also enable policymakers to identify specific areas of reform, compare their country’s performance with that of neighboring nations, and assess the effects of different policies. Finally, we will publish annual updates of the indexes to estimate changes in the degree of freedom and prosperity across the world.
The Freedom Index
Free societies are comprised of a bundle of institutions. We think of freedom comprehensively as a combination of political freedom (democracy and individual rights), legal freedom (the rule of law), and economic freedom (free market economy). Therefore, the Freedom Index aggregates three subindexes (legal, economic, and political freedom), each of them covering several components. This section gives an overview of the operationalization of each of these freedoms, providing a theoretical justification for the choice of components based on well-established definitions in the academic literatures of law, political science, and economics.
Figure 1: Freedom Index structure
(all indicators receive equal weight)
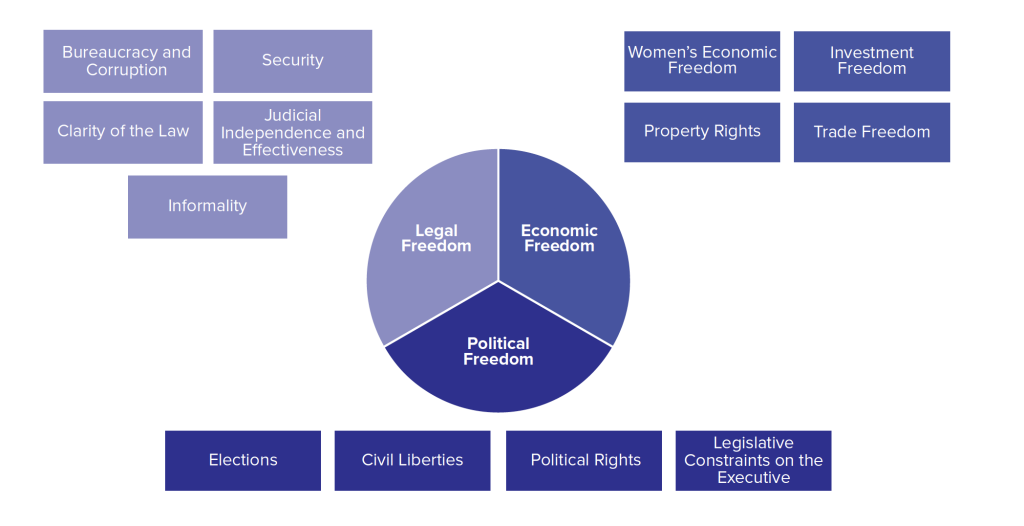
The legal freedom subindex measures the degree to which a country abides by the rule of law. To be sure, there is no uncontested definition of the rule of law, and legal theorists and scholars disagree on the necessary attributes of the concept2For discussions on the different conceptualizations of the rule of law, see J. Waldron, “Is the Rule of Law an Essentially Contested Concept (in Florida)?,” Law and Philosophy 21, no. 2 (2002), 137–164; B. Z. Tamanaha, On the Rule of Law: History, Politics, Theory (Cambridge, United Kingdom: Cambridge University Press, 2004); or T. Bingham, The Rule of Law (London: Allen Lane, 2010).. Given our separate measurement of economic and political freedom, we followed the formal conceptualizations of the rule of law given by jurists such as Lon Fuller, Joseph Raz, or John Finnis3L. L. Fuller, The Morality of Law: Revised Edition (New Haven, Connecticut: Yale University Press, 1969); J. Raz, The Authority of Law: Essays on Law and Morality (Oxford, UK: Oxford University Press, 1979); and J. Finnis, Natural Law and Natural Rights (Oxford: Clarendon Press, 1980).. A simple definition that summarizes this notion is given by Brian Tamanaha: “The rule of law means that citizens and government officials are bound by and abide by the law.”4B. Z. Tamanaha, “The History and Elements of the Rule of Law,” Singapore Journal of Legal Studies (2012): 232–247. Therefore, our measure of legal freedom is stripped of any substantive content, in particular the protection of any individual rights that are included in the political and economic freedom subindexes. The Legal Freedom Index measures the degree to which a country’s citizens and government officials comply with and fairly apply the established laws and regulations, and is thus linked to the ideas of certainty, stability, and predictability. When a country, especially its government, generally abides by the rule of law, individuals can form rational and accurate expectations about the future and consequently make better informed decisions regarding economic, family, or political issues.
We operationalize our selected definition of legal freedom with five components:
- Clarity of the law
- Judicial independence and effectiveness
- Bureaucracy quality and corruption
- Security
- Informality
The political freedom subindex reflects a country’s institutional framework for the selection of those holding executive political power and the limits and controls imposed on its exercise. That is, it is a concept that closely resembles the ideals of democracy and individual rights. The political freedom measurement has four components:
- Elections
- Political liberties
- Civil liberties
- Legislative constraints on the executive
The first component captures the electoral core of democracy: whether political leaders are chosen by the citizenry in open, clean, and fair elections with comprehensive suffrage. Political liberties encompass individual rights directly linked to the democratic political process, such as freedom of expression or association. Jointly, the first two components of the political freedom subindex cover all the attributes and requisites of Robert Dahl’s concept of polyarchy5R. A. Dahl, Polyarchy: Participation and Opposition (New Haven: Yale University Press, 1971)., the most widely accepted definition of democracy among political scientists. Civil liberties include an array of individual rights in the liberal tradition (e.g., criminal procedural rights, absence of torture, freedom of movement, and so on) that limit the scope of governmental action—guaranteeing an area of individual autonomy and freedom in personal affairs. Finally, a democratically elected legislative branch imposes an additional level of control and accountability on the executive’s exercise of power which is captured in the fourth component.
Overall, the political freedom subindex is intended to measure the extent to which governments and lawmakers are responsive to the demands of citizens and respect their individual rights and liberties. The more inclusive the political system, and the more it allows for citizens to oppose and contest those in power, the closer public policies are expected to reflect the preferences of a majority of the population, ultimately producing sustained and shared prosperity for all.
The economic freedom subindex is designed to measure whether the bulk of economic activity in a country is guided by the principles of free and competitive markets. It comprises four components:
- Property rights
- Trade freedom
- Investment freedom
- Women’s economic opportunity
Well-defined and secure property rights are the foundation of a market economy, and the degree to which governments back and enforce such rights is crucial to generate the incentives to work and invest, favoring the level and efficiency of economic activity. Trade freedom refers to the ability to engage in international transactions of goods and services, which allow businesses and individuals to capture the gains of comparative advantage, expanding the country’s production possibility frontier and the efficiency of the allocation of resources by encouraging domestic market competition. Investment freedom addresses the ease of moving capital within and across borders, which can enable the allocation of capital to its most efficient uses, enhancing saving and investment. Finally, women’s economic freedom refers to gender equality in economic affairs. This component reflects the degree to which property rights, trade, and investment freedoms also benefit the female share of the population. Countries where economic freedom is partly or completely absent for the 50 percent of their citizens who are women are necessarily renouncing a significant portion of their economic potential.
Each component is scaled so that all are in the zero to one hundred range. Each subindex (legal, political, and economic freedom) is calculated as the unweighted average of its components. The aggregate Freedom Index also is calculated as an unweighted average of the three subindexes. Figure 1 depicts the complete structure of the Freedom Index.
After arriving at an aggregate score for each country, which ranges from zero to one hundred, we placed countries into four categories: free, mostly free, mostly unfree, and unfree. To do so, we divided the range of scores for all countries in the sample (maximum score minus minimum) and divided it into four equal parts. This procedure generates the thresholds used to assign categories for each country. With the 2022 data, the cutoff levels that divide the four categories of the Freedom Index are 74.88, 54.71, and 34.53.
The Prosperity Index
The Prosperity Index also takes a broad view, going beyond the measurement of pure material well-being and including additional social aspects that are necessary to talk about a prosperous society. To be sure, the choice of constitutive components for a measure of overall prosperity involves a significant degree of subjectivity, making it harder to ground on undisputed social science theory. We are not the first to construct a measure of standards of living that transcends the imperfect measure of GDP per capita, and thus we rely on previous indexes such as the Human Development Index of the United Nations, as well as our extensive discussions with experts and academics, to guide the choice of our prosperity components (see Appendix 2).
Figure 2: Prosperity Index structure
(all indicators receive equal weight)
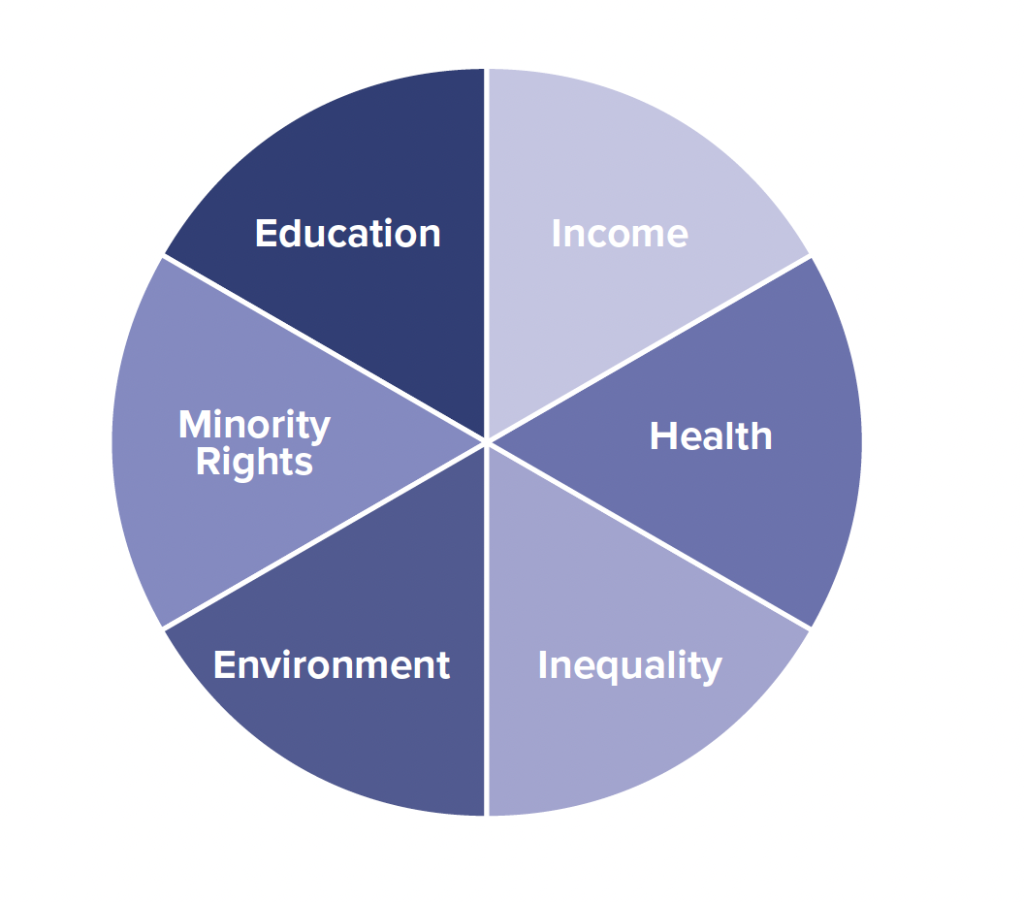
The Prosperity Index has six components:
- Income
- Health
- Education
- Environment
- Minority rights
- Inequality
Adequate data is found for each of them, and each component is then rescaled so that it ranges from zero to one hundred, with higher values denoting better scores. Higher scores in the minority rights or inequality components imply better protected minority rights and greater equality, respectively. The aggregate Prosperity Index is calculated as the unweighted average of the six components.
We recognize the debatable choice of prosperity components and the simple aggregation method we use (see appendix on methodology for context). Thus, whenever possible, we present the results of our analysis not only in terms of an overall index, but also for each individual component. Moreover, we make all our data available to encourage researchers to construct alternative prosperity measures by adjusting the components and aggregation method to the one that best fits their research questions.
Income per capita is the most widely used indicator of prosperity in economic and social science research. A prosperous society is necessarily one that has escaped generalized poverty and misery (i.e., a society where the average household income can comfortably cover basic needs). Our income measure is GDP per capita in constant international dollars6An international dollar in a cited country would buy a comparable amount of goods and services as a US dollar would in the United States, per the World Bank., adjusted for inflation and for purchasing power across countries. Notably, economists and social scientists are aware of the shortcomings of income per capita as an indicator of well-being. In particular, income per capita does not consider distributional aspects; nonmarket activities that may be highly prevalent in less developed countries; and nonmarket externalities such as pollution. Furthermore, other social aspects such as education or health are only imperfectly correlated with income per capita. In our aim to conceptualize prosperity comprehensively, we introduce additional attributes in the Prosperity Index that complement income per capita.
Health and education are standard dimensions of an integral view of human flourishing. Having a long and healthy life, and the opportunity to acquire knowledge, are signs of a prosperous society. The Human Development Index produced by the United Nations—the most popular measure of broad human development—is composed of these three dimensions (income, health, and education), and we follow the UN’s lead by measuring health and education with the same indicators. Health is assessed by life expectancy at birth, while education is captured by the mean years of schooling for adults aged twenty-five years or more, and by expected years of schooling for children of school-entering age.
None of the previous three components capture distributional aspects, as all are average measures across the population. Nevertheless, a prosperous society requires that material well-being is shared among citizens and not concentrated in a small group. Given the positive correlation between income, health, and education, we decided to measure inequality in terms of income. In particular, we use the share of a country’s pretax income accruing to the top 10 percent of earners. We do not use the Gini coefficient, a very popular measure of inequality, because the most reliable and comparable data on this indicator is based on post-tax and post-transfer income, thus capturing not only market inequality but also the capacity of the state to redistribute income through fiscal policy.
The minority rights component also captures the idea of shared prosperity, as it is intended to assess the degree to which citizens in a country enjoy equal opportunity to choose their way of life and pursue human flourishing in an environment of freedom and tolerance, regardless of background. We measure respect for minorities through surveys of acceptance of religious minorities, which serves as a proxy for tolerance of minorities in general (in terms of race, gender, sexual orientation, and so on).
Finally, the Prosperity Index includes environmental quality, which is measured by the death rate from air pollution. The rationale for this component is twofold. First, the ability to live in a clean and sustainable environment is highly valued by citizens across the world, as it significantly enhances quality of life. Second, it serves as a proxy to capture nonmarket negative externalities (i.e., pollution), addressing the previously mentioned shortcoming of income per capita as an overall measure of standards of living. In this way, our Prosperity Index assesses not only the level of prosperity today, but also whether it is sustainable in the future.
After arriving at an aggregate score for each country, which ranges from zero to one hundred, we placed countries into four categories: “prosperous,” “mostly prosperous,” “mostly unprosperous,” and “unprosperous.” For consistency, we follow the same categorization method used for the Freedom Index, dividing the range of prosperity scores into four equal parts, which provides the thresholds between categories. For the 2022 data, these are set at 78.62, 64.85, and 51.08.
Results
This section reviews the findings of the Freedom and Prosperity Indexes during the 1995-2022 period, at a global, regional, and country level.
The Freedom Index
The map in figure 3 (below) depicts a visual representation of the Freedom Index scores around the world using 2022 data and the categories of free, mostly free, mostly unfree, and unfree countries. Detailed freedom scores and ranks for all countries are presented in the table in figure 3.
We also encourage researchers and anyone interested in a specific country to visit the Freedom and Prosperity Indexes website, where we have made available all our data and documentation, as well as interactive capabilities to analyze, plot, and compare scores for the Freedom and Prosperity Indexes, the legal, economic, and political subindexes, and all their components, for all countries covered over the period of 1995 to 2022.
Figure 3. Freedom Index map and ranking table
To see freedom rankings and prosperity rankings side by side, please visit our website.
Freedom around the world
The updated Freedom Index shows that freedom varies greatly across the regions of the world. Based on the index components, Europe (and especially Western Europe) appears far and away the freest. Out of forty-five countries scoring in the “fully free” range, thirty are European. Moreover, the top ten countries in this freedom category are all in Europe. In the North American region, two nations are in the free range (the United States and Canada) and one is in the mostly free category (Mexico). The second region with the highest number in the free category is South Asia and the Pacific, with six out of eighteen economies (Australia, New Zealand, Japan, Taiwan, South Korea, and Singapore). The remaining countries in the free category are clear exceptions within their regions: Cape Verde and the Seychelles in sub-Saharan Africa; Costa Rica, Chile, Uruguay, and Barbados in South and Central America; and Israel in the MENA region.
The list of fully free countries produced by the Freedom Index is not unexpected. It mainly contains the Western world and a handful of nations that have outperformed for many years their regional peers in terms of institutional stability and quality (i.e., the extent to which these institutions are able to provide a stable, predictable, and transparent framework for economic, social, and political activities within a country).
The only nonstandard case is Singapore, an autocracy by many standards, included in the free category. This is a consequence of our comprehensive view of freedom. Our Freedom Index gives equal weight to its three components (economic, legal, and political freedom). It is therefore possible for a state to score relatively high in the overall index even if it significantly underperforms in one dimension. This is the case with Singapore, which has a low score on political freedom (it ranks one hundredth out of 164 countries) but very high scores on legal and economic freedom (ranking sixth and fifteenth, respectively). Yet, Singapore’s success may not be replicable due to its unique small size and open trade policies. The centralized government has prioritized economic and legal freedom, but there is a risk that future leaders may restrict these freedoms to protect their political power. More political freedom could provide safeguards against arbitrary changes and secure Singapore’s prosperity in the long term.
Some regions are moderately homogenous in terms of freedom. In South and Central America, most countries ranked mostly free, with Jamaica, Peru, and Trinidad and Tobago at the top of the fourteen in that category (and behind the four free countries already mentioned). Only three countries from the region are labeled as mostly unfree (El Salvador, Haiti, and Nicaragua), and just Venezuela is in the unfree camp7Cuba is not included in the sample due to a lack of reliable data for most of the variables used to construct our indexes. North Korea, another closed dictatorship, is also excluded for the same reason.. And MENA countries are generally found in the unfree category, with ten countries ranked as mostly unfree and four as unfree (Iran, Libya, Yemen, and Syria). Besides Israel, only four countries in the MENA region are within the mostly free category (Tunisia, Jordan, Kuwait, and Morocco).
In our ranking, nations with available data in sub-Saharan Africa—the area with the highest number of nations (forty-six)—primarily placed in the mostly free and mostly unfree categories (twenty-one and eighteen countries, respectively). For example, Mauritius, Namibia, Botswana, and Ghana scored among the mostly free nations, while Gabon, Rwanda, Mozambique, and Uganda ranked as mostly unfree, but are close to moving into the next higher category. There are a few exceptions: two listed as fully free (Cape Verde and the Seychelles, as mentioned above); and five fully unfree (Chad, Equatorial Guinea, Sudan, South Sudan, and Eritrea)—all long-term, closed dictatorships or nations involved in civil conflict.
Asia is probably the most heterogenous continent in terms of freedom. Besides the six free countries mentioned before, there are eleven mostly free countries, ten mostly unfree, and three fully unfree countries. The two most populous countries of the world, China and India, rank 144th and 104th in the 2023 Freedom Index, respectively. Both countries obtain similar scores for legal and economic freedom, but there is a significant difference in overall freedom due to the much lower level of political freedom in China.
Global and regional trends in freedom since 1995
The extended time coverage of the new version of the Freedom and Prosperity Indexes allows us to analyze the evolution of freedom in the world since 1995. Several interesting preliminary results emerge regarding the variation of freedom and its dimensions in the last three decades. Figure 4 shows the evolution of the average Freedom Index scores for all countries, together with the legal, economic, and political dimensions. Aggregate freedom increased consistently between from 1995 and 2012 but has stagnated since then.
Our Freedom Index signals a clear decrease in freedom starting in 2020, attributable mostly to the COVID-19 pandemic. Given the strict government restrictions imposed around the world8Some authors argue that the reduction in economic freedom due to COVID-19 regulations is far larger than what the Freedom Index shows. See, for example, Vincent Miozzi and Benjamin Powell, “Measuring Economic Freedom during the COVID-19 Pandemic,” Journal of Institutional Economics, Free Market Institute Research Paper No. 4212755, Social Science Research Network, last revised November 25, 2022, http://dx.doi.org/10.2139/ssrn.4212755., the magnitude of the decrease is probably understated, especially in terms of economic freedom. Our economic freedom subindex captures only indirectly the bulk of the freedom-limiting regulations implemented in most countries, given the difficulty in determining the magnitude and, most importantly, the persistence of such regulations.
Looking at the evolution of the scores for legal, economic, and political freedom, one can identify certain patterns.
First, political freedom presents a hump-shape trend in the 1995-2022 period. The increase in political freedom up until 2012 may reflect a continuation of the last part of the third wave of democratization9See Samuel P. Huntington,The Third Wave: Democratization in the Late Twentieth Century (Norman, Oklahoma: University of Oklahoma Press, 1991.). Our political freedom subindex shows a decline since 2012, a phenomenon often referred to as “democratic backsliding” in the political science literature10See Anna Lührmann and Staffan I. Lindberg, “A Third Wave of Autocratization Is Here: What Is New About It?,” Democratization 26, no. 7 (2019): 1095–1113; and/or L. Diamond, “Facing Up to the Democratic Recession,” Journal of Democracy 26, no. 1 (2015): 141–155..
Moreover, when analyzing the components of political freedom, we observe that the process of democratic decrease is mainly driven by a decline in civil and political liberties. The electoral component (free and fair elections) and the legislative constraints component are generally flat from 2010 up to the onset of the pandemic, but the deterioration in the recognition and protection of political and civil rights has dragged political freedom down in the last decade (figure 5).
Perhaps these political freedom trend lines lend support for Francis Fukuyama’s claim that the crisis of liberal democracy the world is facing is more a crisis of liberalism than a crisis of democracy11See Francis Fukuyama, Political Order and Political Decay: From the Industrial Revolution to the Globalization of Democracy (New York: Farrar, Straus and Giroux, 2014); and Francis Fukuyama, Liberalism and Its Discontents (Farrar, Straus and Giroux, 2022)..
The economic freedom data in this study suggest a sharp and steady increase, with the global score rising around 14 percent between 1995 and 2019. This positive evolution is mainly explained by the significant increases in women’s economic freedom around the world, a component with a 25 percent weight in our economic freedom subindex, and to a lesser extent by an improvement in investment freedom (figure 6). Again, we observe a minor decline in economic freedom starting in 2019, especially in trade freedom, attributable to the pandemic.
Legal freedom shows a trend that resembles that of political freedom, but of smaller magnitude. Regarding the components of legal freedom, we observe a mild increase in judicial independence throughout the period, together with a worrisome decline in the component capturing formal legality requirements of the legal system (clarity of the law) since 2010 (figure 7).
Interesting patterns emerge in the evolution of aggregate freedom across regions of the world. First, Europe has closed the initial gap with North America and now has similar levels of freedom. This is mostly because of freedom increases in Eastern Europe and the more pronounced dip in freedom in North America than in Europe between 2015 and 2019 (figure 8, top). The regions of Central and South America, and East Asia and the Pacific both score above the global average, but their evolution differs beginning in 1995 (figure 8, bottom). The former presents a flat trend, and average freedom in 2022 is slightly below the 1995 level; however, it was the 2019 pandemic that interrupted steady increases in freedom in East Asia and the Pacific.
Figure 8. Average freedom by region (1995-2022)
Sub-Saharan Africa shows steady progress in freedom between 1995 and 2019, with a total increase of around 11 percent on the average score of the region in the period. The freedom subindexes for the region suggest that the main drivers of this positive evolution are economic freedom and, to a lesser extent, political freedom. This is certainly good news, but sub-Saharan countries still have ample room for improvement in political and especially legal freedom (figure 9).
The MENA region offers a bleaker picture following the spark of hopes for democratization and liberty during the Arab Spring in the early 2010s. The average level of freedom in 2022 is even lower than in 2010: the level of political freedom in the region is sharply lower than before 2010; and legal freedom has significantly dropped in the last decade (figure 10).
Finally, the South and Central Asia region presents a rather volatile evolution in aggregate freedom (figure 8, right) and also its dimensions, but the overall trend is positive. The average level of freedom in the region has been above MENA’s level for much of the past six years.
The Prosperity Index
Prosperity in the world
Figure 11 (prosperity map) shows the Prosperity Index scores around the world using data through 2022 and our categorization of “prosperous,” “mostly prosperous,” “mostly unprosperous,” and “unprosperous” countries. Detailed prosperity scores and ranks in this 2023 Prosperity Index for all countries are presented in the table in figure 11.
To see freedom rankings and prosperity rankings side by side, please visit our website.
The prosperity map resembles the one for freedom, but there also are clear differences. First, all countries ranked as fully prosperous also rank as fully free, but not all free countries are in the top prosperity category. This may give support to two intuitions: freedom could be a necessary condition for prosperity—but it might not be sufficient, or at least there’s no proof that freedom instantly translates into prosperity. Put differently, freedom and its dimensions may take time to have an effect on prosperity, a hypothesis that we further explore in section 3 below.
The distribution of countries across categories is generally not surprising, but some individual countries present unexpected results. Prosperous economies are located mainly in the Western world (Europe and North America). Australia, New Zealand, Japan, South Korea, Taiwan, and Israel are outside of Western Europe and North America and are included in our prosperous category.
The mostly prosperous category includes forty-one countries, with Lithuania, Argentina, Croatia, and Poland leading the list.
The United Arab Emirates is ranked fortieth overall in terms of prosperity and enters the mostly prosperous category. Propelled by high scores on income, health, and environment, the UAE is the highest ranked mostly unfree nation and outperforms almost all mostly free countries in our analysis.
Other resource-rich countries face a similar situation, reaching higher levels of prosperity than what we would have expected, given their freedom scores (Oman, Qatar, Gabon). In general, the mostly prosperous nations are located in Eastern Europe and Latin America. Mauritius and Seychelles are the only sub-Saharan countries to reach our mostly prosperous level.
A total of eighty-nine countries (54.2 percent of the total) are categorized in the two lowest categories: fifty-nine ranked as mostly unprosperous and thirty as unprosperous. In terms of world population, the numbers are even more disappointing, as some of the most populous countries of the world (China, India, Indonesia, Nigeria, Pakistan) all fall in these two categories. In particular, 49 percent of the world population live in mostly unprosperous countries, and 29 percent in fully unprosperous nations.
Countries among the mostly unprosperous group are predominantly from the MENA and sub-Saharan Africa regions, with the latter group usually located at the bottom of the category.
Cape Verde and Georgia are the only fully free countries that do not reach the prosperous or mostly prosperous categories. Both are cases in which the initial level of prosperity was very low; even if the movement toward free institutions has been clear and sustained for a long time now, the initial level effect persists. China also is among the mostly unprosperous countries, ranking 119th overall.
Finally, a total of thirty countries are labeled as unprosperous. Most of them are in sub-Saharan Africa (twenty-two), together with Laos, Haiti, India, Pakistan, Myanmar, Syria, Afghanistan, and Yemen. Some of the worst performers in our study of prosperity are or were experiencing war and conflict (Yemen, Afghanistan, South Sudan, Syria).
Global and regional trends in prosperity since 1995
Figure 12 shows the evolution of the Prosperity Index and its components since 1995, at a global level (average across countries). It is important to note that we have data through 2022 for just one indicator of our Prosperity Index: minority rights. For the income, health, and inequality components, the last year of available data is 2021; and for environment and education, it is 201912Data for education are obtained from the United Human Development Index (HDI). While this source provides data up to 2021, a vast majority of the national statistical offices on which the UN relies do not seem to have updated their estimates since 2019, and thus the education scores are flat for almost all countries since then.. This is relevant for the interpretation of the trends in prosperity, as the straightlining observed in the figure in the last two to three years of the period most likely does not completely reflect the actual situation.
Notwithstanding the previous caveat, the trend in overall prosperity since 1995 is positive and sustained. The average global score has increased by ten points, an 18 percent rise from the 1995 level. The education, health, and environment components are the main drivers of the positive aggregate trend, and to a lesser extent income. The inequality component presents a flat trend, with a very mild decrease from 1995 to 2007, followed by a slow recovery to a 2022 level slightly above the one in 1995.
The most worrisome trend among the components of prosperity is that of minority rights, which has been worsening since 2012 and is now below the level in 1995. Minority rights are closely linked to democracy and political freedom more generally13See, for example, Iris Marion Young, Inclusion and Democracy, 2002; Francis Fukuyama, The Origins of Political Order, 2011; and Arend Lijphart, Democracy in Plural Societies: A Comparative Exploration, 1977., and the democratic backsliding mentioned above seems to affect this component. Moreover, as we will see below, this decrease is especially pronounced in developed countries in Europe and North America, the very birthplaces of democracy.
The evolution of prosperity and its components across regions is very heterogenous, especially when we compare Europe and North America on the one hand, with the rest of the developing and least-developed areas on the other. The reason is clear. Because developed countries started the period of study at a higher level of health, income, education, and minority rights, it is appropriate to analyze these two groups of regions separately.
Aggregate prosperity levels for Europe and North America are shown in figure 13: Europe has a steep upward trend line until 2019; North America logs a mild increase until 2016 and a slight fall in the last few years. As a result, Europe surpassed North America as the most prosperous region of the world in 2007. Since then, we have observed a growing disparity between these two regions, although the numerical discrepancy remains relatively modest when considering it as a percentage. We can further diagnose this result by looking at the components of prosperity, as well as focusing on the United States, the driver of the North American trend (see figure 14).
First, Europe has improved faster than the United States in education and health, and to some extent in income. Our data suggests that Eastern European countries are causing these movements. Second, the deterioration of minority rights is obvious in both regions since 2015, but the absolute decline is larger in the United States. Finally, while inequality shows a mainly flat trend for Europe, the United States has experienced an increase in inequality of twelve points in this component since 1995.
The advancement in prosperity among the rest of the regions of the world is shown in figure 15. All of them present positive progress in overall prosperity, but with different growth rates. Regions that started with a lower level of prosperity in 1995 (sub-Saharan Africa and South and Central Asia) have grown faster and caught up with those starting from higher levels (Central and South America and East Asia and the Pacific). The MENA region is the one that presents a slower growth rate in prosperity, especially since 2011, causing the region to diverge from the rest of the developing world. The region increased its prosperity score by 10.7 percent, compared to the global increase of 15.7 percent.
The components driving the overall increase in prosperity are also different across regions (figure 15). Sub-Saharan African countries have mainly improved in terms of environment and health, 25.7 points and 15 points, respectively. Education has grown quickly in the region, but it started from a very low initial level, so the average score on this component for the region is still much lower than for the rest of the world. In East Asia and the Pacific as well as South and Central Asia there is growth in education, health, and environment—plus remarkable growth in income per capita. The Central and South America region presents a positive trend in reducing inequality (14 percent), differentiating it from the rest of the world, that shows a negative or flat trend in this component. Finally, the MENA region has experienced clear, positive trends only in education, where the regional average doubled, and, to a lesser extent, health, while all other prosperity dimensions are mainly stagnant.
Countries with the biggest increases and declines in scores
It is interesting to see which countries have experienced the biggest changes in freedom since 1995. On the positive side, Sierra Leone, Indonesia, Gambia, Peru, Georgia, and Croatia show the biggest improvements in terms of their freedom scores, with gains of more than 25 points (figure 16). On the other hand, the freedom scores of fifty-three countries out of 164 declined since 1995. Many of them logged small negative changes and often due to restrictions imposed amid the COVID-19 pandemic in the last three years; however, other nations’ scores suggest significant deterioration in freedom including Venezuela, Nicaragua, Belarus, Turkey, Russia, and Yemen, with declines of thirteen points or more in scores (figure 16). Many of these cases—of success or failure—are analyzed in more detail in section 3 below.
Figure 16. Biggest improvers and decliners (Freedom score, 1995-2022)
Finally, figure 17 shows the evolution of the prosperity score for the countries with the largest movements across the whole period of analysis. Top performers are mainly in sub-Saharan Africa including Ethiopia, Rwanda, and Sierra Leone, all with increases of around twenty points in their prosperity score (figure 17).
The global prosperity score increased steadily and meaningfully in the period of study until the COVID-19 outbreak caused a flattening and slight decrease in this trend. Only very few countries saw an absolute decrease in their prosperity score, among them Syria, Lebanon, and Venezuela (figure 17, center).
We also identified nine countries that had a 1995 prosperity score above the global average—but a 2022 prosperity score below the global average including Brazil, Jordan, Libya, Mexico, the Philippines, and South Africa.
Figure 17. Biggest improvers and decliners (Prosperity score, 1995-2022)
Key Takeaways
The new version of the Freedom and Prosperity Indexes allows us not only to describe the evolution of freedom and prosperity across space and time but also to tackle the main question of this project, namely, the relationship between these two measures. In this section, we provide some preliminary results in terms of the contemporaneous relation between freedom and prosperity, and the most probable direction of causality. We complement our aggregate empirical analysis with qualitative assessments of specific countries that either support our main conclusions or are outliers that contradict our premises.
Overall, we find that freedom and prosperity are closely correlated, and this positive association is robust. Second, freedom tends to lead to prosperity, even if this effect is usually not instantaneous and arrives with a lag. Finally, outliers that have produced improvements in prosperity despite a lack of freedom in some dimension are exceptional (Singapore, China), and the question of whether this situation is sustainable in the long run is still open.
Prosperity is highly correlated with freedom
Figure 18 shows the relation between the scores in the Freedom Index and the Prosperity Index for all countries during the period of study. Based on a correlation coefficient of 0.80, we conclude that freedom and prosperity are highly correlated. Countries with higher levels of freedom also have higher levels of prosperity, and those with low levels of freedom have relatively low levels of prosperity. The regression line depicted in figure 18 yields a coefficient of 0.58, which implies that an additional point in the Freedom Index score is associated with more than half a point higher score on prosperity. Furthermore, the R^2 statistic of this univariate regression implies that 63 percent of the variance in prosperity can be explained by differences in freedom. Given our descriptive analysis of section 2 above, this is not a surprise, as the results of figure 18 resemble very closely the overlap between freedom and prosperity visually apparent in the freedom and prosperity maps.
A question raised by the conclusion of a close relationship between freedom and prosperity comes from the fact that we are pooling together countries from all continents, and thus disregarding significant differences among regions. However, a strong positive association between freedom and prosperity scores is also present within regions. The correlation coefficient is above 0.6 for all regions, except South and Central Asia (0.41), which is probably due to the small number of countries (twelve) in that region. So across all regions, we observe that countries with higher freedom scores also have higher levels of prosperity.
Freedom tends to lead to prosperity
The enhanced time coverage of the 2023 version of the Freedom and Prosperity Indexes permits us to go beyond the contemporaneous correlation identified in the previous section and study the direction of causality between freedom and prosperity.
In a nutshell, freedom and prosperity are closely associated, but which causes which? Does freedom today lead to prosperity tomorrow or is the demand for freedom a consequence of societies becoming more prosperous? To be sure, this is a question that has received extensive attention from economists and political scientists, and is still a matter of heated debates14See Daron Acemoglu and James A. Robinson, The Narrow Corridor: States, Societies, and the Fate of Liberty (New York: Penguin Press, 2019); Daron Acemoglu et al., “The Economic Consequences of Democracy and Dictatorship,” Journal of Political Economy 127, no. 5 (2019): 2431–2485; Esther Duflo and Abhijit V. Banerjee, Good Economics for Hard Times: Better Answers to Our Biggest Problems (New York: PublicAffairs, 2019); Francis Fukuyama, The End of History and the Last Man (New York: Free Press, 1992); Marek Hanusch and Philip Keefer, “The Impact of Economic Freedom on Corruption: Different Patterns for Rich and Poor Countries,” World Development 78 (2016): 308–323; Thomas Piketty, Capital in the Twenty-First Century, trans. Arthur Goldhammer (Cambridge, Massachusetts: Belknap Press imprint, Harvard University Press, 2014); Adam Przeworski, Democracy and Development: Political Institutions and Well-Being in the World, 1950-1990 (Cambridge, UK: Cambridge University Press, 2000); and Joseph E. Stiglitz, “Does Economic Freedom Really Cause Good Economic Outcomes?,” Challenge 56, no. 6 (2013): 53–69.. We hope that our indexes will be useful to researchers exploring this crucial issue. In this section, we provide some preliminary evidence that we think indicates that freedom tends to lead to prosperity.
One can start by noting that freedom in 1995, at the start of the sample period, is positively correlated with prosperity in 2022, at the end of the sample period. This association is statistically significant at the one percent level. The time lapse between the explanatory variable (freedom) and the dependent variable (prosperity) is sufficiently long to ensure that no feedback loop—from higher prosperity to increased freedom—is responsible for the result (figure 19). When running the reverse regression (freedom in 2022 on prosperity in 1995), the R2 statistic is lower, at 0.553, which provides some support for the argument that the direction of causality runs from freedom to prosperity.
We look for outliers in the data to see whether some countries defy this long-term pattern. Yemen is such a country: in recent years, it has become a failed state and regional powers vie for a dominant positions at the expense of the prosperity of the population. These dynamics are consistent with Yemen’s relative standing: more freedom and less prosperity relative to the sample trend line. In essence, past freedoms were insufficient to lead to prosperity in 2022—as the civil war (engulfing the country since 2014) undermined it.
The case of Yemen demonstrates a general pattern: countries in civil war or countries involved in other recent conflicts tend to be below the trend line. Examples include Burkina Faso (2015-16 conflict), Chad (2005-2010), Mali (2012-present), and South Sudan (2013-2017).
At the other end of the spectrum, the United Arab Emirates stands out as having a high level of prosperity in 2022 and fewer freedoms at the start of the sample period. This seeming discrepancy can be explained by the able management of natural resources.
To further explore causality, our analysis looks at the effect of changes in freedom on the changes in prosperity during the 1995-2022 period of study. The intuition we test here is that countries that increased their freedoms the most should also be the countries where prosperity increased the most. This approach removes the effect of such constant determinants of prosperity as natural resource abundance, geography, culture, and institutional quality. We find that the evolutions in prosperity are affected by changes in freedom (figure 20).
Our analysis applies a stricter test of causality by eliminating from our analysis all countries with little change in freedom over the sample period: in this way we restrict the causality link only to true “movers” on the freedom spectrum. We only included in our analysis countries whose freedom score increased or decreased by at least five points between 1995 and 2022. When this stricter analysis is performed, there is again evidence for the causality running from freedom to prosperity.
At the bottom left corner, decreased freedoms in Venezuela during the regimes of Hugo Chavez and Nicolas Maduro, starting in 1999 and continuing to the present day, have resulted in the largest drop in prosperity anywhere in the world—except for Syria, suffering under the tyranny of the Assad family (Hafez and then, beginning in 2000, his son Bashar). Belarus under Alyaksandr Lukashenka and Russia under Vladimir Putin are in this category as well.
At the other end of the spectrum, Rwanda and Sierra Leone are examples of countries with rapid positive changes in their total freedom score that have also experienced increased prosperity, albeit from initially low levels.
To be sure, changes in freedom do not immediately bring about changes in prosperity. The lag depends on various place-specific factors, and also factors related to the condition of the global economy. One can, for example, speculate that the increased levels of freedom in Taiwan have not yet resulted in a commensurate increase in prosperity due to the effect of the COVID-19 pandemic that severely limited global trade and investment. Conversely, the limits to freedoms in Mali may yet reduce prosperity as the effects of the protracted civil war are now manifesting themselves in reduced social and economic indicators.
The relationship between changes in freedom and change in prosperity is disrupted, however, by civil conflict or war if there is a shift toward dictatorship and closed economic policies. Over time, such shifts will become evident in prosperity measures. This is why the explanatory power of freedom on prosperity is around 60 percent (as measured by the regression analysis behind figure 20). The remainder of the explanation lies in sudden shocks such as war and civil conflict, the rise of dictatorships, and the advent of global crises, be they economic, financial, or healthcare in nature.
Based on the data, one can also speculate that the imperfect relation between a change in freedom and the change in prosperity is asymmetric. Losses in freedom result in swift losses in prosperity, as illustrated by Yemen, Venezuela, and Syria. In contrast, improvements in freedom take a longer time to result in improved prosperity. In other words, it takes a longer time to build than to destroy. The manifestation of this pattern is that the largest number of countries in figure 20 are in the bottom right quadrant, with significant changes in freedom, but relatively lower increases in prosperity than what the trend line would suggest.
Autocracies tend to be unprosperous
Some argue that a ruler with complete control over a country can bring stability, make needed economic and social changes, and increase prosperity. But such examples in the period we studied are rare. In societies without freedom, decisions are made by those in power rather than through fair institutions. Sometimes these decisions may benefit the economy in the short term by directing resources to more productive areas. But without increases in freedom, these authoritarian leaders are likely to harm in the long term any progress they make in the short term. Our data support the view that free markets are a better way to develop the economy than the decisions made by one person or a central group.
Today, no countries ranked unfree or mostly unfree are in the prosperous category. Only ten of the forty-five mostly unfree countries managed to make it to the mostly prosperous category and none are in the prosperous category.
Former European republics of the USSR
A great natural experiment that illustrates the claim that freedom tends to lead to prosperity is provided by developments in the former European Soviet republics. At the time of the break-up of the USSR, Russia, Ukraine, Belarus, Moldova, Lithuania, Estonia, and Lithuania all had the same (very limited) level of freedom.
Our data shows that by 1995 (the beginning of our period of study), the Baltic republics made a clearer choice for freedom than the other countries in the group. Throughout our sample period, this gap in the data only increased, with the Baltic states (and Moldova after 2009) increasing their levels of freedom, while the scores of Russia and Belarus trailed them by more than fifteen points.
The evolution of the prosperity scores resembles this divergence in freedom: Latvia, for example, scored only 2.5 points above Russia in 1995 but was almost fifteen points higher by 2022 (figure 21).
Peru and Venezuela
Another interesting comparison involves Peru and Venezuela. In 1995, Venezuela outperformed Peru on the freedom measure by almost twenty points; now, however, Peru is nearly forty points ahead, after making a clear turn toward freedom around the year 2000. Venezuela, meanwhile, shows the largest fall on the freedom scale in our sample—shedding around thirty points.
The effect on prosperity for each country is equally astonishing. Despite the higher initial level of prosperity of Venezuela in 1995 and the effect of high oil revenue in the early 2000s, the country is now below its initial prosperity level of 1995. In contrast, Peru has seen a clear increase in prosperity, and now significantly surpasses Venezuela (figure 22).
Burundi and Rwanda
Our final country comparison comes from sub-Saharan Africa. Rwanda and Burundi are among the biggest movers in terms of freedom. Rwanda’s freedom score rose by more than twenty points in the 1995-2022 period, following a civil war in 1994—the legal and economic freedom components drove most of the increase. In contrast, Burundi’s freedom score dwindled by more than four points (about 10 percent). In terms of prosperity, Rwanda has clearly outperformed the global average, with a rise of nearly twenty points and surpassed Burundi by the middle of our sample period (figure 23).
Figure 23. Side-by-side charts of Burundi and Rwanda
Rwanda is but one example of a nation that chose the path to economic and legal freedom while not simultaneously increasing its political freedom. South Korea and Taiwan followed a similar progression in the 1960s and 1970s, first scoring gains in economic and legal freedom, and only later adding political freedom. Today, Singapore and the United Arab Emirates have high scores in economic and legal freedom, but lower scores in political freedom.
Should political freedom take too long to evolve, however, the gains from economic and legal reforms may be reversed. Russia in the 1990s and 2000s is a prime example of such a reversal. And China seems to have been following the same path in recent years: economic freedom and legal freedom have remained stable in our sample, but political freedom has declined by 26 percent since Xi Jinping took office in 2013. Prosperity had increased 17 percent from 1995 to 2013, but has since plateaued.
Conclusions and policy recommendations
The preliminary data and analysis in this report strengthen the case for liberal democracy, understood as the combination of strong rule of law, democracy, and a market economy, as the surest path to overall prosperity. All truly prosperous countries of the world present high levels of freedom in all three dimensions.
Furthermore, freedom is neither the “Western recipe” for prosperity nor just one among many avenues for success. Within regions, freer countries are outperforming their peers and reaching higher levels of prosperity. Reformers in the least developed countries, as well as international organizations in the development community, should be more confident than ever in promoting a development model based on freedom.
The argument that outlier cases contradict the general conclusion that freedom is necessary for prosperity should be taken with caution, for several reasons.
First, while there are clear exceptions, they are usually explained by very specific country characteristics that are extremely difficult to replicate elsewhere. Instead, the comprehensive freedom model has proved its benefit in different regions and periods of time.
Those willing to advocate and put in place institutions and policies that promote freedom must understand that the positive effects of freedom on prosperity are not instantaneous. It takes time to establish and consolidate free institutions, and the effects on prosperity accumulate in the medium to long run.
Second, relatively unfree countries that have experienced above average increases in prosperity in the last few decades are still far below free countries. For example, despite the strong economic growth of China since the 1980s, its level of prosperity is still just around 60 percent of that of the freest and most prosperous countries of the world. Only time will tell whether China can continue to catch up with the developed world without a significant increase in political freedom, but the development slowdown observed in recent years casts serious doubts on this hypothesis.
Third, countries that have increased their prosperity based on an unbalanced combination of freedom (especially a lack of political freedom) tend to underperform and deteriorate in terms of the more inclusive dimensions of prosperity. Equality, minority rights protection, and generalized education typically suffer under politically “unfree” regimes.
If sustained improvements in all three dimensions of freedom have proved to generate overall prosperity, our results also indicate that the erosion of institutions can have devastating effects. Sustained regressive processes in legal, political, and/or economic freedom can destruct prosperity as much as outright war and civil conflict, as the relative performances of Venezuela and Syria show. Therefore, free and prosperous countries in the developed world should not underestimate the significance of losses in civil and political liberties, both due to their intrinsic undesirability and their potential to diminish prosperity in the future
The Freedom and Prosperity Indexes represent a useful tool for both agents of change and reformers in countries around the world, and for international development organizations. The indexes provide clear benchmarks to identify areas of improvement and a template to design and implement specific and tailored country reforms.
Importantly, those willing to advocate and put in place institutions and policies that promote freedom must understand that the positive effects of freedom on prosperity are not instantaneous. It takes time to establish and consolidate free institutions, and the effects on prosperity accumulate in the medium to long run. Moreover, reforms toward freedom often generate increased uncertainty and costs in the short run. Long-term prosperity requires a commitment to stay the course.
In this sense, international organizations and the international donor community should play a role in smoothing the transition toward free institutions, cushioning the short-term costs of pro-freedom reforms, and supporting agents of change within least developed countries with the vision and commitment to place their nations on the path of freedom.
Appendix 1: Freedom and Prosperity Indexes Methodology
The Freedom and Prosperity Indexes are a creation of the Atlantic Council’s Freedom and Prosperity Center. The center’s mission is to increase the well-being of people everywhere—and especially of the poor and marginalized in developing countries—through unbiased, data-based research on the relationship between freedom and prosperity.
The center’s work is both theoretical and practical. It aims to produce research regarding the best path to development, but also to apply the conclusions of this research through reform proposals, education, and an active media presence around the world. It is in this spirit that we created the Freedom and Prosperity Indexes.
They are two separate indexes that rank 164 countries around the world according to their levels of freedom and prosperity. All index measurements are weighted equally and the score for each index is simply the average of its component parts. Scores range between zero and one hundred, with higher values indicating more freedom or prosperity. The indexes are constructed using publicly available datasets produced by other prominent organizations and international institutions.
The Freedom Index ranks countries according to the equally weighted average of three subindexes: economic freedom, political freedom, and legal freedom. Each country’s score ranges between zero and one hundred, with higher values indicating more freedom.
Countries are placed into four categories based on their scores: “free,” “mostly free,” “mostly unfree,” and “unfree.” For each given year, we use the range of scores for all countries in the sample (maximum score minus minimum score) and divide it into four equal parts. This procedure generates the thresholds used to assign categories for each country. For the year 2022, the cutoff levels of the freedom score dividing the four categories are 74.88, 54.71, and 34.53.
The Prosperity Index ranks countries according to the equally weighted average of six indicators: income, health, education, environment, minority rights, and inequality. The index is scaled so that a country’s score ranges between zero and one hundred, with higher values indicating more prosperity.
The definition of a prosperous society is the subject of an ongoing theoretical debate that involves various perspectives from fields such as economics, sociology, political science, and philosophy. One view is that prosperity is characterized by high levels of economic growth and material wealth, as measured by metrics like GDP per capita. This approach emphasizes the importance of policies that promote free markets, investment, and innovation to achieve sustained prosperity. However, critics of this view argue that a narrow focus on economic growth can lead to negative consequences for society, including income inequality, environmental degradation, and social exclusion.
Another perspective on prosperity suggests a more holistic approach that considers social cohesion, environmental sustainability, and human well-being as key components of a prosperous society. Proponents of this view argue that policies should be designed to promote these outcomes, in addition to economic growth and material wealth.
There is also a debate about the contested and value-laden nature of the concept of prosperity, with some arguing that different societies may have different ideas about what constitutes prosperity and that these ideas may evolve over time.
Here we took the holistic approach and captured the most commonly accepted components in the literature and for which data was available. We decided to give equal weight to all to remain neutral.
Countries are placed into four categories based on their scores: “prosperous,” “mostly prosperous,” “mostly unprosperous,” and “unprosperous.” For each given year, we use the range of scores for all countries in the sample (maximum score minus minimum score) and divide it into four equal parts. This procedure generates the thresholds used to assign categories for each country. For the year 2022, the cutoff levels of the prosperity score dividing the four categories are set at 78.62, 64.85, and 51.08.
The indexes use data produced by the Fraser Institute, the Global Burden of Disease Collaborative Network, the Heritage Foundation, the United Nations, the Varieties of Democracy (V-Dem) Institute, the World Bank, World Economics, and the World Inequality Database. In the few exceptional cases in which we do not have data for a variable from our preferred source, we use alternative sources of data. These instances are listed in each relevant section.
The Freedom and Prosperity Indexes cover the period of 1995 to 2022. For the most recent year, the indexes use the most recent data available. For the Freedom Index, most of these data are from 2022. For the Prosperity Index, most of these data are from 2021. If a country-year observation is missing for a given variable, we use the value from the closest preceding year.
Besides the necessary scaling to ensure that all components lie in the same range (zero to one hundred), we do not make any additional transformations except for gross domestic product (GDP) per capita, which is linearized before scaling by taking the natural logarithm.
Freedom Index
The Freedom Index has three subindexes that measure economic freedom, political freedom, and legal freedom, respectively. Each subindex is comprised of multiple indicators. The indicators used to construct each subindex are listed below, together with the original sources of data and analyses.
I. Economic Freedom
Economic freedom refers to an economic system that upholds the rights of all businesses and entrepreneurs. Economic freedom is measured as an equally weighted average of four indicators: property rights, trade freedom, investment freedom, and women’s economic freedom.
a. Property Rights
The property rights indicator assesses the extent to which a country’s legal framework allows individuals to acquire, hold, and utilize private property, secured by clear laws that the government enforces. It provides a quantifiable measure of the degree to which a country’s laws protect private property rights and the extent to which those laws are respected.
Source of data: Fraser Institute, Component 2C Protection of Property Rights, Economic Freedom. For details on the methodology of Component 2C, see “Appendix Explanatory Notes and Data Sources,” Fraser Institute, accessed May 4, 2023.
b. Trade Freedom
The trade freedom indicator covers a diverse range of trade restrictions, encompassing tariffs, quotas, hidden administrative restraints, and regulations on exchange rates and capital mobility. A high score reflects a nation that maintains low tariffs, enforces streamlined and effective customs clearance processes, has a freely convertible currency, and imposes minimal restrictions on the movement of both physical and human capital.
Source of data: Fraser Institute, Component 4 Freedom to Trade Internationally, Economic Freedom of the World. For details, see “Appendix Explanatory Notes and Data Sources.”
c. Investment Freedom
The investment freedom indicator assesses several regulatory limitations that are usually enforced on investments. Points are subtracted from a country’s investment regime’s perfect score of one hundred for each restriction present. An ideal score indicates a country with unrestricted flow of investment capital, allowing individuals and firms to transfer their resources freely into and out of specific activities, both within the country and across its borders.
Source of data: Heritage Foundation, Index of Economic Freedom. See “Methodology,” Heritage Foundation, accessed May 4, 2023.
d. Women’s Economic Freedom
The women’s economic freedom indicator attempts to capture inequality in legislation between men and women throughout the duration of a woman’s working life, from the time she can enter the labor force through retirement. It is the average of four equally weighted components: mobility (including women’s agency and freedom of movement), pay, entrepreneurship, and assets. Each component is measured on a scale of zero to one hundred, with higher values representing more equality.
Sources of data: World Bank indicators on mobility, pay, entrepreneurship, and assets, Women Business and the Law. For details, see World Bank.
II. Political Freedom
Political freedom measures the institutional framework for the selection of those holding executive political power and the limits and controls imposed on exercising this power. It is a concept that closely resembles the ideals of democracy and individual rights. Political freedom is measured as an equally weighted average of the following four indicators: elections, civil liberties, political rights, and legislative constraints on the executive.
a. Elections
The elections indicator captures the electoral core of democracy, that is, whether political leaders are chosen by the citizenry in open, clean, and fair elections with ample suffrage. It is an equally weighted average of four components: alternative sources of information, share of population with suffrage, clean elections, and elected officials.
Sources of data: V-Dem dataset including Alternative Sources of Information Index (v2xme_altinf), share of population with suffrage indicator (v2x_suffr), Clean Elections Index (v2xel_frefair), and Elected Officials Index (v2x_elecof). For details on the methodology of each component, see “V-Dem Codebook V13,” V-Dem website, accessed May 4, 2023.
b. Civil Liberties
The civil liberties indicator includes an array of individual rights in the liberal tradition (i.e., criminal procedural rights, absence of torture, freedom of movement, etc.) that limit the scope of governmental action guaranteeing an area of individual autonomy and freedom in personal affairs. It is an equally weighted average of two components: private liberties and physical violence.
Sources of data: V-Dem dataset including private liberties indicators (simple average of v2xcl_slave, v2clfmove, v2xcl_dmove, v2csrlgrep) and Physical Violence Index (v2x_clphy).
c. Political Rights
The political rights indicator encompasses individual rights directly linked to the democratic political process, such as freedom of expression or association.
Source of data: V-Dem dataset, Political Civil Liberties Index (v2x_clpol).
d. Legislative Constraints on the Executive
The legislative constraints on the executive indicator evaluates the level of control the democratically elected legislative branch has on the executive’s exercise of power.
Source of data: V-Dem dataset, Legislative Constraints on the Executive Index (v2xlg_legcon).
III. Legal Freedom
Legal freedom measures the degree to which a country abides by the rule of law, has a legal system that fairly protects property and contract rights, and prevents corruption and the arbitrary abuse of power. Legal freedom is measured as the equally weighted average of five indicators: clarity of the law, judicial independence and effectiveness, bureaucracy and corruption, security, and informality.
a. Clarity of the Law
The clarity of the law indicator measures the basic formal requirements of the legal system, in particular if laws are general, clear, public, noncontradictory, consistent, and are predictably enforced.
Source of data: V-Dem dataset, Transparent Laws with Predictable Enforcement Index (v2cltrnslw).
b. Judicial Independence and Effectiveness
The judicial independence and effectiveness indicator measures the strength of an efficient and fair judicial system, which ensures that laws are fully respected and that any violations are met with appropriate legal action. It is an equally weighted average of two components: Judicial Constraints on the Executive Index, and independent and accessible justice components.
Sources of data: V-Dem dataset including Judicial Constraints on the Executive Index (v2x_jucon), and independent and accessible justice data (simple average of v2xcl_acjst, v2juaccnt, v2jureview, v2jupurge, v2jupoatck).
c. Bureaucracy and Corruption
The indicator on bureaucracy and corruption measures the degree to which government officials are subject to and comply with the law. It is an equally weighted average of two components: government effectiveness and control of corruption.
Sources of data: World Bank, Worldwide Governance Indicators (WGI) for government effectiveness and control of corruption. See World Bank WGI website, accessed May 4, 2023.
d. Security
The security indicator measures whether the citizenry generally observes the country’s legal norms and regulations. It is based on perceptions of the likelihood of political instability or violence driven by political motives, such as terrorism.
Sources data: World Bank, Worldwide Governance Indicators for political stability and absence of violence/terrorism.
e. Informality
The informality indicator measures informal economic activity. Data for this indicator is expressed as a percentage of GDP made up by the informal economy. To convert to a scale of zero to one hundred, we subtract that value from the perfect score of one hundred. High scores represent less informality.
Sources of data: The simple average of the World Bank’s Dynamic General Equilibrium model-based estimates of informal output and the World Economics Quarterly Informal Economy Survey.
Prosperity Index
The Prosperity index attempts to capture both the average level of prosperity, through the level of purchasing power and human capital that an average citizen displays, and shared prosperity, through measures of environment quality as well as income inequality and the well-being of minority group. Countries are scored and ranked according to the equally weighted average of six indicators. The index scores are indicated on a scale from zero to one hundred, where zero represents the worst performance in the sample and one hundred the best. The indicators are listed below.
I. Income
The income indicator is measured according to GDP per capita, expressed in constant 2017 US dollars and adjusted for purchasing power parity (PPP). The original data is linearized before scaling by taking the natural logarithm. Higher scores indicate greater GDP per capita.
Sources of data: “GDP per capita, PPP, constant 2017 international $,” World Bank; for data for Eritrea, South Sudan, Venezuela, and Yemen, see the IMF’s “World Economic Outlook” databases; for data for Syria, see Penn World Table; and for data for Afghanistan and Taiwan see World Economics.
II. Environment
The environment indicator is measured through death rates from air pollution. Death rates are measured as the number of deaths per 100,000 people from both outdoor and indoor air pollution. Rates are age-standardized, meaning they assume a constant age structure of the population to allow for comparisons between countries and over time. Higher scores indicate fewer deaths.
Sources of data: Institute for Health Metrics and Evaluation, 2019 Global Burden of Disease study.
III. Minority Rights
The minority rights indicator is measured through surveys on the acceptance of religious minorities. The level of acceptance of religious minorities is used as a proxy for the acceptance of minorities in general. This indicator specifies the extent to which individuals and groups have the right to choose a religion, change their religion, and practice that religion in private or in public as well as to proselytize peacefully without being subject to restrictions by public authorities.
Source of data: V-Dem dataset, religious rights indicator (v2clrelig).
IV. Health
The health indicator is measured through life expectancy. The measurement of life expectancy is expressed in years that a newborn infant would be expected to live if the prevailing patterns of mortality at the time of birth were to stay the same throughout the individual’s life.
Source of data: United Nations, Department of Economic and Social Affairs, Population Division, “World Population Prospects 2022: Data Sources,” UN DESA/POP/2022/DC/NO. 9, 2022.
V. Education
The education indicator is measured through both expected years of schooling and mean years of schooling. Both values are multiplied, and the result is converted to a scale of zero to one hundred.
Source of data: United Nations Human Development Index.
VI. Inequality
The inequality indicator measures the equal distribution of income across the population. It is measured through the share of a country’s pretax income accrued to the top 10 percent of earners. Higher scores indicate lower inequality.
Source of data: World Inequality Database, Top 10 Percent Share of Pretax National Income.
Limitations
The Freedom and Prosperity Indexes methodology is designed to be an easily replicable way to benchmark specific characteristics. But it also has limitations that should be understood.
Ensuring comparability of the data across a global set of countries is a central consideration. When selecting sources to be included in the indexes, coverage has been a determining factor. In the rare case of missing data for a certain year, we have used data from the closest precedent year as a replacement.
Data were collected over the past year, using the most recent information available. They might not reflect the latest political or economic developments. These indexes should not necessarily be taken as an accurate reflection of the most recent current events.
We will, however, update the indexes over time to capture real-world changes on an annual basis. We did our best to collect the most reliable information available. The objective of these indexes is to provide standardized measures that can be applied to every country. One might argue that the methodology or the data collected are irrelevant to certain types of political situations or specific countries. That might be the case in some instances, but rarely so. Moreover, there is an inherent tension between generalizable and specific knowledge. In this study, we self-consciously opt for the former. We encourage other researchers to explain how our indexes illuminate or obscure country-specific dynamics.
Appendix 2: List of participants to the 2023 Freedom and Prosperity Research Conference
Authors and technical advisers
About the authors


Technical advisers


Acknowledgements
We are grateful for the contribution of Ben Powell, PhD, a professor at Texas Tech University and a Director of the Free Market Institute, and of Yomna Gaafar.
The Freedom and Prosperity Indexes are a creation of the Atlantic Council’s Freedom and Prosperity Center. The center’s mission is to increase the well-being of people everywhere—and especially of the poor and marginalized in developing countries—through unbiased, data-based research on the relationship between freedom and prosperity.